Discussion
In order to generate technically sound scores with consideration of the intended uses of the scores, two major types of psychometric analyses were performed (dimensionality and vertical scaling analyses). These analyses, which were conducted during test development, also offered empirical evidence to strengthen
TABLE 8.10 Descriptive Statistics of Vertically Scaled Difficulty Parameter Estimates and Student Proficiency Estimates.
|
Language Skill |
Grade/ Grade Span |
Number of Items |
Number of Students |
Item Difficulty Estimate |
Student Proficiency Estimate |
Effect Size |
||||||
|
Min. |
Max. |
Mean |
SD |
Min. |
Max. |
Mean |
SD |
|||||
|
Oral |
K |
78 |
5,360 |
-5.46 |
1.73 |
-3.08 |
1.12 |
-7.31 |
2.45 |
-1.76 |
0.97 |
|
|
1 |
99 |
6,376 |
-5.87 |
-1.02 |
-3.04 |
0.97 |
-6.49 |
2.29 |
-1.06 |
0.92 |
0.69 |
|
|
2 |
105 |
6,353 |
-5.11 |
1.30 |
-2.67 |
0.99 |
-4.86 |
3.80 |
-0.59 |
1.04 |
0.41 |
|
|
3-5 |
III |
6,040 |
-5.87 |
2.56 |
-2.42 |
1.23 |
-4.47 |
4.97 |
0.04 |
1.15 |
0.51 |
|
|
6-8 |
114 |
5,675 |
-4.67 |
6.06 |
-1.74 |
1.60 |
-6.93 |
9.70 |
0.43 |
1.54 |
0.23 |
|
|
9-10 |
118 |
6,090 |
-5.54 |
5.64 |
-1.67 |
1.71 |
-7.88 |
12.05 |
0.58 |
2.07 |
0.07 |
|
|
11-12 |
118 |
5,181 |
-4.33 |
8.96 |
-1.39 |
1.72 |
-7.75 |
13.76 |
0.72 |
2.04 |
0.07 |
|
|
Written |
K |
61 |
5,339 |
-9.84 |
-1.86 |
-4.35 |
1.22 |
-8.68 |
1.82 |
-2.88 |
1.18 |
|
|
1 |
109 |
6,374 |
-5.97 |
-0.28 |
-3.12 |
0.97 |
-6.09 |
1.58 |
-1.51 |
1.03 |
1.00 |
|
|
2 |
116 |
6,369 |
-3.67 |
0.72 |
-2.26 |
0.73 |
-5.41 |
3.54 |
-0.83 |
1.13 |
0.48 |
|
|
3-5 |
121 |
6,077 |
-5.48 |
6.78 |
-0.73 |
1.49 |
-4.09 |
7.78 |
0.03 |
1.10 |
0.62 |
|
|
6-8 |
124 |
5,762 |
-2.62 |
7.20 |
0.40 |
1.71 |
-4.09 |
7.74 |
0.60 |
1.15 |
0.51 |
|
|
9-10 |
124 |
6,163 |
-2.98 |
8.91 |
0.55 |
1.70 |
-5.99 |
9.00 |
0.86 |
1.42 |
0.21 |
|
|
11-12 |
124 |
5,199 |
-2.83 |
8.94 |
0.69 |
2.27 |
-4.66 |
11.00 |
1.18 |
1.30 |
0.24 |
|
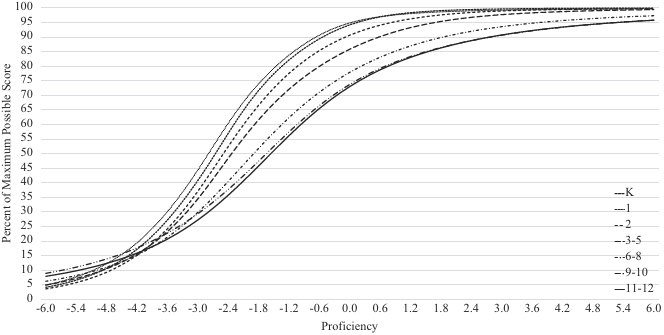
FIGURE 8.4 Percentage metric TCCs of oral language proficiency scores.
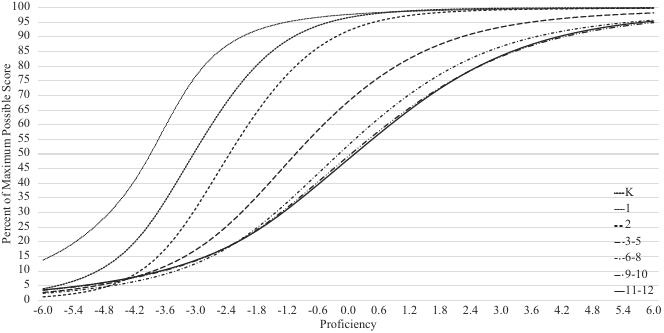
FIGURE 8.5 Percentage metric TCCs of written language proficiency scores.
a validity argument for the Summative ELPAC. That is, the results of these analyses support the claim that ELPAC scores can be used to monitor EL students’ development of oral and written language proficiency across grades.
It is worth noting that both psychometric and practical issues were considered in determining the best-fitting dimensionality model for the Summative ELPAC. Key psychometric considerations were the number of dimensions, the relationship between dimensions, and the meaning of dimensions. Three of the four factor models included in the study were acceptable based on the model fit indices. Even though two of the factor models had slightly better statistical results for model fit, the oral and written factor model was selected because of three practical considerations: it allowed for shorter test length and testing time, it allowed for lower reading and writing score weights for kindergarten students, and it provided structural consistency across all grades/grade spans.
Additionally, the results from the dimensionality analysis yielded essential validity evidence regarding the internal structure of the Summative ELPAC. It is critical to evaluate the internal structure of the test to ensure that the structure is consistent with the defined constructs so as to facilitate appropriate test use and score interpretation (AERA, APA, & NCME, 2014). The dimensionality analysis results empirically evaluated the hierarchical structure of Summative ELPAC scores, supporting the conceptual framework suggested by the CA ELD Standards.
The dimensionality analysis was necessary but not sufficient to establish the intended use and interpretation of the test scores that satisfy the needs of the Summative ELPAC? program. Both federal and California laws require that the state track the progress of student ELP from year to year. To satisfy this requirement, Summative ELPAC? score reports need to provide information about ELP across grades/grade spans on a common scale that leads to valid interpretations of student progress. Thus, the vertical scale analysis was crucial to place Summative ELPAC? scores from different levels of ELP on a single scale from kindergarten through Grade 12 to facilitate inferences about student growth.
In this study, the vertical scale analysis showed expected patterns of student performance across grades/grade spans, indicating that ELP was measured properly over time for a valid interpretation of student growth. Although there was a weak grade-to-grade difference in mean proficiency scores between higher grades (Grades 9—10 and Grades 11-12), overall both average item difficulty and mean proficiency estimates increased as the grade/grade span increased. As a result, appropriate information was provided in Summative ELPAC? score reports for monitoring annual student progress in ELP, making instructional plans, and contributing to decisions about whether a student should be reclassified as fluent English proficient.
It is important to mention the limitations of our study, which are in turn worthwhile psychometric considerations for future study. In our study, four parallel field test forms were constructed to minimize the item pool exposure. A minimal student sample was selected for each form and each student completed only one form to limit the student fatigue and impact on instruction (1,250 to 1,500 students per form). The sparseness of data for each form and the complicated item sharing design limited the types of statistical analyses that were performed during the dimensionality analysis. For example, two different types of goodness of model fit indices (incremental and absolute measures of fit [Tucker-Lewis Index and Root Mean Square Error of Approximation]) were not performed during the field test analysis. It will be valuable to conduct a post-hoc dimensionality analysis using operational test data to determine whether additional analyses confirm the internal test structure established during the field test analyses. Collecting additional validity evidence in support of the measurement invariance of the oral and written language skills for subgroups (e.g., gender, ethnicity, native language, and test delivery mode) will be another interesting topic for future research since the measurement invariance study supports a valid score interpretation across subgroups.
References
American Educational Research Association. American Psychological Association, & National Council on Measurement in Education. (2014). Standards for educational and psychological testing. Washington, DC: American Educational Research Association.
Bachman, L. F., & Palmer, A. S. (1982). The construct validation of some components of communicative proficiency. TESOL Quarterly, /6,449-465.
Bagozzi, R. P., & Yi, Y. (1988). On the evaluation of structural equation models. Journal of the Academy of Marketing Science, 16, 74—94.
Bailey, A.. & Wolf, M. K. (2020). The construct ofEnglish language proficiency in consideration of college and career readiness standards. In M. K. Wolf (Ed.), Assessing English language proficiency in U.S. K—12 schools. New York, NY: Routledge.
Briggs, D. C., & Weeks, J. P. (2009). The impact of vertical scaling decisions on growth interpretations. Educational Measurement: Issues and Practice, 28(4), 3—14.
Cai, L. (2013). FlexMIRT® 3.0: Flexible multilevel multidimensional item analysis and test scoring /computer software/. Chapel Hill. NC: Vector Psychometric Group. LLC.
California Department of Education. (2014). California English language development standards, Kindergarten through grade 12. Sacramento, CA: Author. Retrieved from www.cde.ca. gov/sp/el/er/ documents/eldstndspublicationl 4.pdf
California Department of Education. (2017). Summative assessment test blueprints for the ELPAC. Sacramento, CA: Author. Retrieved from www.cde.ca.gov/ta/tg/ep/docu ments/elpacadoptedblueprints.pdf
Educational Testing Service. (2009). Guidelines for the assessment of English language learners. Princeton. NJ: Author.
Every Student Succeeds Act. (2015). Every Student Succeeds Act of 2015, Pub. L. No. 114-95 § 114 Stat. 1177.
Faulkner-Bond, M., Wolf, M. K., Wells, C., & Sireci, S. (2018). Exploring the factor structure of a K—12 English language proficiency assessment. Language Assessment Quarterly, 15(2), 130-149.
Goodman, D. P., & Hambleton. R. K. (2004). Student test score reports and interpretive guides: Review of current practices and suggestions for future research. Applied Measurement in Education, /7(2), 145-220.
Hunsaker, R. A. (1990). Understanding and developing the skills of oral communication: Speaking and listening (2nd ed.). Englewood, CO: J. Morton Press.
Kenyon, D. M., MacGregor, D., Li, D., & Cook, H. G. (2011). Issues in vertical scaling ofa K—12 English language proficiency test. Language Testing, 28(3), 383—400.
Kim, S. H., & Kolen, M.J. (2004). STUIRT: A computer program for scale transformation under unidimensional item response theory models /computer software/. Iowa City, IA: University of Iowa.
Kolen. M. J., & Brennan, R. L. (2004). Test equating, scaling and linking (2nd ed.). New York, NY: Springer-Verlag.
Kunnan, A. J. (1995). Test taker characteristics and test performance: A structural equation modeling approach. Cambridge, England: Cambridge University Press.
Llosa, L. (2012). Assessing English learners’ progress: Longitudinal invariance of a standards-based classroom assessment of English proficiency. Language Assessment Quarterly, 9(4), 331-347.
Sawaki, Y., Stricker, L., & Oranje, A. (2008). Factor structure of the TOEFL internet-based test (iBT): Exploration in afield trial sample (Research Report No. TOEFLiBT-04). Princeton, NJ: Educational Testing Service.
Stocking, M. L., & Lord, F. M. (1983). Developing a common metric in item response theory. Applied Psychological Measurement, 7(2), 201—210.
Tong, Y., & Kolen, J. M. (2007). Comparisons of methodologies and results in vertical scaling for educational achievement tests. Applied Measurement in Education, 20(2), 227-253.
Wolf, M. K., Guzman-Orth, D., & Hauck, M. C. (2016). Next-generation summative English language proficiency assessments for English learners: Priorities for policy and research. (Research Report No. RR—16-08). Princeton. NJ: Educational Testing Service.
Wolf, M. K., Kao, J., Griffin, N.. Herman, J. L., Bachman, P., Chang, S. M., & Farnsworth, T. (2008). Issues in assessing English language learners: English language proficiency measures and accommodation uses—Practice review (CRESST Technical Report No. 732). Los Angeles, CA: University of California.
Yen, W. M. (2009). Measuring student growth with large-scale assessments in an education accountability system. A paper presented at the exploratory seminar: Measurement challenges within the Race to the Top agenda. Center for K—12 Assessment and Performance Management. Princeton, NJ: Educational Testing Service. Retrieved from www.ets. org/Media/Research/pdf7 YenReactorSessionl.pdf
Zenisky, A. L., & Hambleton, R. K. (2012). Developing test score reports that work: The process and best practices for effective communication. Educational Measurement: Issues and Practice, 31(2), 21-26.

