Cost-Effectiveness of the Business Models Adopted by High-Growth Enterprises – A Multidimensional Analysis
On the basis of the set of diagnostic variables constructed for the purpose of this study, the values of the SMD were determined in accordance with formulas (1)—(5), which are presented in Table 5.1.
Tie analysis of the values of the synthetic measure of development in the years 2013-2017 shows that individual voivodeships in Poland differed in terms of the financial condition of HGEs located in them. Tie voivodeships with the highest values of the synthetic measure of development in 2013 were Malopolskie (0.6227), Pomorskie (0.5604),
Table 5.1 The Values of the Synthetic Development Measure and Ranking of Voivodeships According to the Value of the Synthetic Measure of Development in the Years 2013-2017
|
VOIVODESHIP |
VOIVODESHIP POSITION IN THE RANKING ACCORDING TO SMD |
SYNTHETIC MEASURE OF DEVELOPMENT |
||||||||
|
2013 |
2014 |
2015 |
2016 |
2017 |
2013 |
2014 |
2015 |
2016 |
2017 |
|
|
DolnoSl^skie |
4 |
2 |
5 |
3 |
2 |
0.4441 |
0.5320 |
0.4814 |
0.5500 |
0.4039 |
|
Kujawsko-Pomorskie |
12 |
14 |
13 |
14 |
13 |
0.2592 |
0.2462 |
0.3345 |
0.2706 |
0.1877 |
|
Lubelskie |
15 |
9 |
16 |
16 |
16 |
0.1573 |
0.3345 |
0.1282 |
0.2002 |
0.1657 |
|
Lubuskie |
10 |
12 |
12 |
10 |
11 |
0.2709 |
0.3268 |
0.3366 |
0.3443 |
0.2080 |
|
todzkie |
8 |
11 |
8 |
7 |
8 |
0.3151 |
0.3319 |
0.4026 |
0.4374 |
0.3062 |
|
Matopolskie |
1 |
6 |
6 |
5 |
4 |
0.6227 |
0.4125 |
0.4505 |
0.5256 |
0.3742 |
|
Mazowieckie |
6 |
5 |
4 |
4 |
1 |
0.3884 |
0.4422 |
0.5269 |
0.5449 |
0.4142 |
|
Opolskie |
9 |
13 |
11 |
15 |
15 |
0.2763 |
0.3064 |
0.3389 |
0.2060 |
0.1681 |
|
Podkarpackie |
7 |
16 |
15 |
12 |
10 |
0.3386 |
0.1795 |
0.2661 |
0.3128 |
0.2301 |
|
Podlaskie |
14 |
7 |
9 |
9 |
9 |
0.2022 |
0.3846 |
0.3898 |
0.3666 |
0.2886 |
|
Pomorskie |
2 |
1 |
3 |
2 |
3 |
0.5604 |
0.5537 |
0.5315 |
0.5545 |
0.3892 |
|
Sl^skie |
3 |
3 |
1 |
1 |
6 |
0.4839 |
0.5266 |
0.5781 |
0.5855 |
0.3339 |
|
Swiptokrzyskie |
16 |
15 |
14 |
13 |
5 |
0.1096 |
0.2419 |
0.2912 |
0.2904 |
0.3386 |
|
Warmirfsko- Mazurskie |
11 |
10 |
10 |
11 |
14 |
0.2667 |
0.3328 |
0.3513 |
0.3210 |
0.1736 |
|
Wielkopolskie |
13 |
8 |
7 |
8 |
7 |
0.2430 |
0.3826 |
0.4463 |
0.4271 |
0.3194 |
|
Zachodniopomorskie |
5 |
4 |
2 |
6 |
12 |
0.3900 |
0.4853 |
0.5461 |
0.5095 |
0.1990 |
and Slqskie (0.4839). The best conditions for the development of HGEs in 2013 were present in the Malopolskie voivodeship, as the enterprises from this voivodeship achieved the optimal level of the financial liquidity ratio (close to the median value of 24%), the highest indicators: performance effectiveness (109.7%), turnover profitability (9%), the gross value of fixed assets (PLN 62.3 million per enterprise), and also had a significant share in creating jobs (17.4% share in total employment in all enterprises from the voivodeship surveyed by CSO). For this reason, the synthetic measure of development for this voivodeship in 2013 is the closest to benchmark value 1 which corresponds to the reference object. In the following three years, Pomorskie and Slqskie voivodeships also occupied the highest positions in rankings describing the financial condition of HGEs. The values of the SMD were in the range of 0.5315-0.5545 for the Pomorskie voivodeship and 0.5266-0.5855 for the Slqskie voivodeship, which turned out to be one of the highest in the studied group of HGEs. Enterprises from the Pomorskie and Slqskie voivodeships in the years 2013-2016 were characterized by relatively high values of the indicators of: performance (106-108%), turnover profitability (5-7%), and gross fixed assets per one enterprise (Sl^skie) compared to other enterprises, as well as a high liquidity ratio (the Pomorskie voivodeship). Employment in HGEs also had a significant share in the total employment in all surveyed entities in the Pomorskie and Slqskie voivodeships (15-18% in 2013, 13-14% in 2016). In 2017, the highest values of the synthetic measure of development were found in the following voivodeships: Mazowieckie (0.4142), Dolnoslqskie (0.4039), and Pomorskie (0.3892). It is worth noting that the Dolnoslqskie voivodeship continually occupied high positions in the SMD rankings which in the consecutive years of the 2013-2017 period were: 4 (SMD = 0.4441), 2 (SMD = 0.5320), 5 (SMD) = 0.4814), 3 (SMD = 0.55), and 2 (SMD = 0.4039). Mazowieckie voivodeship owes the highest ranking position in 2017 to high indicators describing the gross value of fixed assets (PLN 29.5 million/enterprise) and shortterm investments (PLN 13.5 million/enterprise), as well as a high average salary (PLN 5,570 per employee per month) and the highest share of HGEs in the studied group of enterprises (11.61%) compared to other voivodeships.
The worst positions in the rankings in 2013 and in the years 2015- 2017 were occupied by the Lubelskie voivodeship with the estimated synthetic measure of development in the range of 0.1282-0.2002. The deteriorating financial condition of the HGEs in this voivodeship is indicated by low values of the financial liquidity ratio (15-17%), low short-term investments (PLN 1.89-2.16 million/enterprise), and one of the lowest remuneration level in the group of surveyed enterprises monthly (2,910-3,250 PLN on average/employee). In addition, HGEs in the Lubelskie voivodeship do not have a significant impact on the development of the region as in other Polish voivodeships. They constitute from 6% to 7% of all surveyed enterprises, and people working in these enterprises constitute from 5% to 8.5 % of employee population in this voivodeship. In the years 2016-2017, Opolskie voivodeship also performed unfavorably in the rankings with the value of the synthetic measure of development of 0.2060 and 0.1681, respectively. HGEs located in the Opolskie voivodeship encountered the biggest problems with maintaining financial liquidity (financial liquidity ratio of 10-11%, significantly below the median), as well as turnover profitability (the lowest values of the ratio 1.9-2.2% among all HGEs in Poland). Also, in terms of efficiency, HGEs from the Opolskie voivodeship had the worst results with the index of 102% indicating relatively low total revenues compared to total costs incurred. It is worth noting the group of HGEs from the Podkarpackie and Swi^tokrzyskie voivodeships. Their rankings gradually began to improve in the last two years. Especially in the light of the fact that the synthetic measure of development for Swi^tokrzyskie voivodeship in 2013 reached the lowest value of 0.1096, which was the closest value to the anti-pattern. In 2017, HGEs from the Swi^tokrzyskie voivodeship significantly improved their overall financial condition by increasing business efficiency (from 103.5% in 2013 to 123% in 2017), increasing turnover profitability (from 3.4% to 18.3%), and increasing short-term investments (from PLN 2.3 to 11 million/enterprise).
The charts in the box plots presented in Figure 5.1 show selected descriptive statistics for the estimates of synthetic measures of development in the years 2013-2017. "Drey indicate a growing trend in the SMD value, and, accordingly, a gradual improvement in the financial condition of HGEs in Poland in the years 2013-2016. In 2013, an average voivodeship in Poland was characterized by a development index of 0.333, while in 2016 the average value of this indicator was 0.4029. For half of Polish voivodeships, the synthetic development rate reached at least 0.2957 in 2013 and 0.3969 in 2016. This trend reversed in 2017 when the synthetic measure of development for an average voivodeship in Poland was 0.2813, which is below the average value observed in the years 2013-2016. In half of the voivodeships, the values of the synthetic measure of development in 2017 did not exceed 0.2974. Moreover, the highest level of diversification of Polish voivodeships in terms of the value of the synthetic development indicator was observed in 2013 and the lowest in 2014. Similar trends can be observed for the 25th and 75th percentile values.
In 2013 and 2015 in two voivodeships in Poland, namely, Lubelskie and Swi^tokrzyskie (2013) and Lubelskie and Podkarpackie (2015), SMDs had values below the lower limit of a typical variation area (0.1915-2013, 0.2800-2015). In 2017, the synthetic development indicators did not reach the lower value of a typical area of variation (0.1909) in as many as four voivodeships: Lubelskie, Opolskie, Warminsko-Mazurskie, and Kujawsko-Pomorskie, despite the fact that their values were lower than in previous years. In 2013, on the
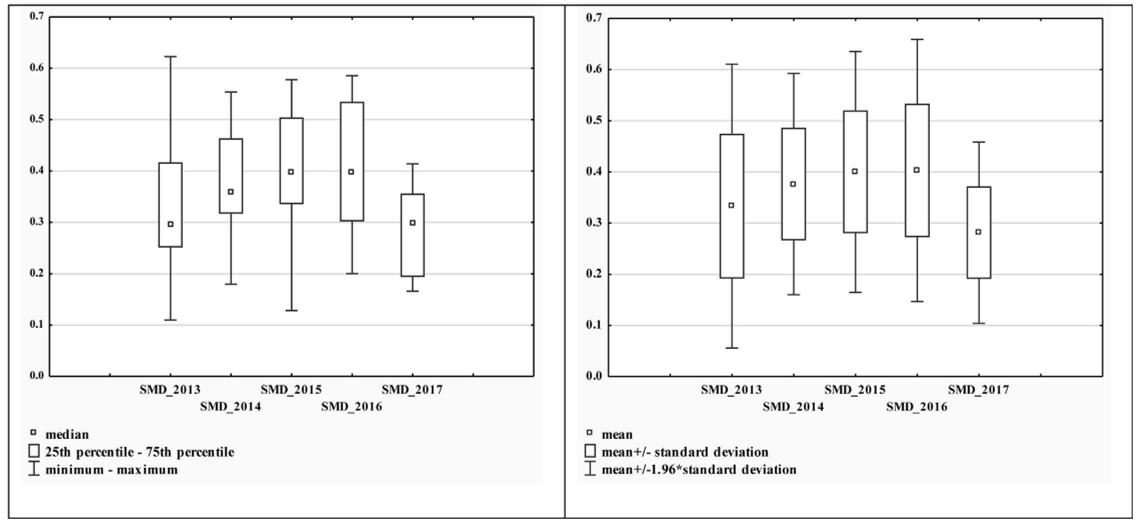
Figure 5.1 The box plots for the estimates of synthetic measures of development in the years 2013-2017.
other hand, the values of the synthetic measure exceeded the upper limit of a typical variability area (0.4745) in the case of Malopolskie, Pomorskie, and Slqskie voivodeships. In 2015, the upper limit of a typical variation in the value of the synthetic measure of development increased to the level of 0.5200, and yet it was exceeded by four voivodeships: Slqskie, Zachodniopomorskie, Pomorskie, and Mazowieckie. In 2017, SMD values higher than the upper limit of a typical variability area (0.3716) were recorded in four voivodeships: Mazowieckie, Dolnosl^skie, Pomorskie, and Malopolskie.
To sum up the above considerations, it should be emphasized that in all voivodeships and in all of the analyzed years, the estimated values of the SMD were significantly different from unity. In 2017, the values were even closer to the anti-pattern value than to the reference object. This means that none of Polish voivodeships can be treated as a reference object due to the conditions of the development of HGEs. In the majority of voivodeships in Poland, the overall financial condition of HGEs deteriorated in 2017 compared to previous years, which may be a warning signal for decision makers developing the region’s economic development strategy.
In the next step of the analysis, the assumption that in particular voivodeships in Poland there were similar conditions conducive to the development of HGEs over several years was checked using the Friedman rank test. This test is a nonparametric equivalent of a univariate analysis of variance with repeatable measurement, which is why it was selected to examine the differences between five dependent variables (SMD2013, SMD2014, SMD2015, SMD2016, and SMD2017) corresponding to synthetic measures of development in the years 2013-2017 (cf. King and Minium, 2009).
Tie results of Friedman rank test for SMD values (25,450) which are presented in Table 5.2 indicate the occurrence of significant differences in the distribution of the values of the synthetic measure in the years 2013-2017 at the significance level of 0.01. Tiis means that the conditions for the development of HGEs in Polish voivodeships changed in the analyzed years, which is indicated by significantly different values of the measure describing the financial condition of these enterprises in five consecutive years. It can be concluded, therefore, that the location of HGEs significantly affects the financial results they achieve, and, accordingly, the functioning of an enterprise in
Table 5.2 Wilcoxon and Friedman Rank Test for the Synthetic Development Measure and Rankings of Voivodeships According to the Value of the Synthetic Measure of Development in the Years 2013-2017
|
SMD (BASE YEAR)_SMD (ANALYZED YEAR) |
WILCOXONTEST FOR SMD |
WILCOXON TEST FOR RANKINGS |
||||
|
T |
Z |
P-VALUE |
T |
Z |
P-VALUE |
|
|
SMD2013_SMD2014 |
32.000 |
1.862 |
0.063 |
59.500 |
0.028 |
0.977 |
|
SMD2013_SMD2015 |
22.000 |
2.379 |
0.017 |
55.500 |
0.256 |
0.798 |
|
SMD2013_SMD2016 |
18.000 |
2.585 |
0.011 |
44.000 |
0.105 |
0.917 |
|
SMD2013_SMD2017 |
34.000 |
1.758 |
0.079 |
53.500 |
0.369 |
0.712 |
|
SMD2014_SMD2015 |
28.000 |
2.068 |
0.039 |
40.500 |
0.349 |
0.727 |
|
SMD2014_SMD2016 |
33.000 |
1.810 |
0.070 |
48.500 |
0.251 |
0.802 |
|
SMD2014_SMD2017 |
12.000 |
2.896 |
0.004 |
57.500 |
0.142 |
0.887 |
|
SMD2015_SMD2016 |
59.000 |
0.465 |
0.642 |
35.000 |
0.314 |
0.754 |
|
SMD2015_SMD2017 |
5.000 |
3.258 |
0.001 |
26.500 |
0.102 |
0.919 |
|
SMD2016_SMD2017 |
3.000 |
3.361 |
0.001 |
44.500 |
0.070 |
0.944 |
|
Friedman rank ANOVA test |
||||||
|
Friedman test statistics - SMD |
25.450 |
p-value |
0.00004 |
|||
|
Friedman test statistics - rankings of voivodeships |
0.12329 |
p-value |
0.99818 |
|||
Note: N is the number of unrelated and important cases (N = 16); T is the critical value of Wilcoxon test for group size n < 25; Zis the critical value of Wilcoxon test for group size n > 25; p-value is the significance level of the test result. The results in bold are statistically significant at the 0.05 significance level.
a given province translates into the profitability of business models adopted by enterprises. To check in which year the values of the SMD difFered the most from the other estimates, the Wilcoxon signed rank test for matched pairs was performed for each pair of dependent variables (cf. Table 5.2). Significant differences in the distribution of the synthetic measures at the significance level of 0.01 were identified for the years 2014 and 2017, 2015 and 2017, and 2016 and 2017. At the significance level of 0.1, on the other hand, the values of the synthetic measure of development in individual voivodeships in Poland did not show significant differences in 2015 and 2016. Therefore, the results of the Wilcoxon test confirmed the previously formulated observations about the occurrence of a general upward trend in the value of the SMD in the years 2013-2016 and a significant decrease in the value of this measure in 2017.
It was also checked, using Friedman rank test and Wilcoxon pair order test, whether rankings of voivodeships carried out for the years 2013-2017 according to the value of the SMD (cf. Table 5.1) would also show differences. At the level of significance of 0.05, it was not confirmed that the positioning of voivodeships in terms of the financial condition of HGEs changed significantly in the years 2013-2017 (cf. Table 5.2). This proves that the position of a given province in the SMD rankings is relatively stable in the analyzed years. Therefore, the changes observed in the financial condition of HGEs located in individual voivodeships in the years 2013-2017 do not affect their position in the rankings (Mesjasz-Lech, 2019).
Spearman rank correlation (5.13) and Kendall tau (5.14) coefficients were also estimated to identify the voivodeships in which the conditions for the development of HGEs were the best in a long-term perspective (cf. Table 5.3).
On the basis of the analysis of the results presented in Table 5.3, one can draw a conclusion about the occurrence of positive and statistically significant correlation relationships between the rankings of voivodeship in the years 2013 and 2017. Only the Kendall tau test
Table 5.3 Spearman Rank Correlation and Kendall Tau Coefficients for Rankings of Voivodeships According to the Value of the Synthetic Measure of Development
|
VARIABLE |
SPEARMAN RANK CORRELATION COEFFICIENT |
||||
|
SMD2013 |
SMD2014 |
SMD2015 |
SMD2016 |
SMD2017 |
|
|
SMD2013 |
1.0000 |
0.6206 |
0.7294 |
0.7765 |
0.5059 |
|
SMD2014 |
0.6206 |
1.0000 |
0.8647 |
0.8382 |
0.5324 |
|
SMD2015 |
0.7294 |
0.8647 |
1.0000 |
0.9176 |
0.5794 |
|
SMD2016 |
0.7765 |
0.8382 |
0.9176 |
1.0000 |
0.7735 |
|
SMD2017 |
0.5059 |
0.5324 |
0.5794 |
0.7735 |
1.0000 |
|
KENDALL TAU COEFFICIENTS |
|||||
|
SMD2013 |
SMD2014 |
SMD2015 |
SMD2016 |
SMD2017 |
|
|
SMD2013 |
1.0000 |
0.4167 |
0.5167 |
0.5833 |
0.3167 |
|
SMD2014 |
0.4167 |
1.0000 |
0.7333 |
0.6333 |
0.3667 |
|
SMD2015 |
0.5167 |
0.7333 |
1.0000 |
0.7667 |
0.4667 |
|
SMD2016 |
0.5833 |
0.6333 |
0.7667 |
1.0000 |
0.6000 |
|
SMD2017 |
0.3167 |
0.3667 |
0.4667 |
0.6000 |
1.0000 |
Note: The correlation coefficients in bold are significant for p < 0.05.
at the significance level of 0.05 shows no reason to reject the null hypothesis about the lack of correlation relationship between the positioning of voivodeships according to SMD in the extreme years of the analyzed period, that is, in 2013 and 2017. This indicates a similarity in the positioning of voivodeships in the rankings according to the financial condition of the analyzed groups of HGEs. The voivodeships that created favorable conditions for the development of high- growth enterprises in the long term (2013-2017) were Dolnoslqskie, Mazowieckie, Pomorskie, and Sl^skie; and in the last analyzed year, the conditions for the development of high-growth enterprises deteriorated in the Sl^skie voivodeship and improved in the Mazowieckie voivodeship.

