Method
This article introduces two methods not currently commonly used by police: a combination of order-preserving hashing that allows attributes of many different kinds to be made comparable and a clustering technique based on singular value decomposition that allows similarities and differences among incidents to be detected and visualised. Second, social networks based on co-presence at incidents are constructed and embedded, allowing a different kind of structural similarity to be visualised.
First, an order-preserving hashing technique, developed by the authors, was applied to the incident records, converting them into records whose attributes were entirely numeric. This deals with attributes such as addresses, names, crime codes, and so on, in a consistent way. The resulting data was clustered using singular value decomposition, enabling them to be visualised in a three-dimensional space in which closeness accurately represents similarity. In such visualisations, therefore, incident records that are globally similar are placed close to one another, enabling clusters and other kinds of structures to be detected. Incident records also contain geographical coordinates, enabling attribute values to be overlaid on a map of Kingston, so that patterns associated with locations can also be visualised.
Second, the social network corresponding to co-presence at an incident was constructed from the incident records. Each node in this graph corresponds to an individual; weighted edges between each pair of individuals records how
Leveraging police incident data 59 often both were present at the same incident during 2015. Since a total of 30,654 individuals were involved in incidents, these data were thresholded to select only those who appear frequently. Versions of this social network with different thresholds were embedded using a technique called spectral embedding. This places nodes (corresponding to individuals) at positions that reflect their closeness, via weighted edges, in the entire social network, and so enable their significance to be seen directly in the visualisation. Thus, spectral embedding is the social network analogue of singular value decomposition clustering. Other properties can be overlaid on these visualisations; in particular, we label each node by how often each individual was arrested at any of the incidents during the year.
Results
We first present the results obtained by clustering the incident records, followed by results from the social networks. We examine six different perspectives on the global similarity of incident records:
- 1 Similarity among all incident records, including those that do not involve a crime, and where the interaction with police is at the police station;
- 2 Similarity with respect to administrative attributes, that is the way in which police respond to incidents (for example, matching the response to the apparent kind and severity of an incident);
- 3 Similarity with respect to geography, exploring whether different regions of the city are served differentially;
- 4 Distinctions between mental health incidents and all others, hinting that predictive models could be built to guide responding officers;
- 5 Similarity among incident records associated with actual crimes (rather than the large number of interactions with the public where no actual crime has occurred); and
- 6 Similarity among incident records where response was deemed to require a high priority response.
Some of these perspectives inform the relationship between police and city (are police unbiased?), while others inform police performance on then- own terms (are dispatches appropriate to the nature of a call?).
Similarity among all incident records
Attributes associated with dates were eliminated since they only introduce a gradient across the incident records for the year. The basic clustering of all incident records is shown in Figure 5.1.
Figure 5.1 contains one point for each incident record; records are close to one another when they ar e similar'; and therefore, the visible structure indicates that there are (at least) three significant clusters: one to the left; one down and to the right; and one up and to the right. This is global similarity, calculated across all of the attributes
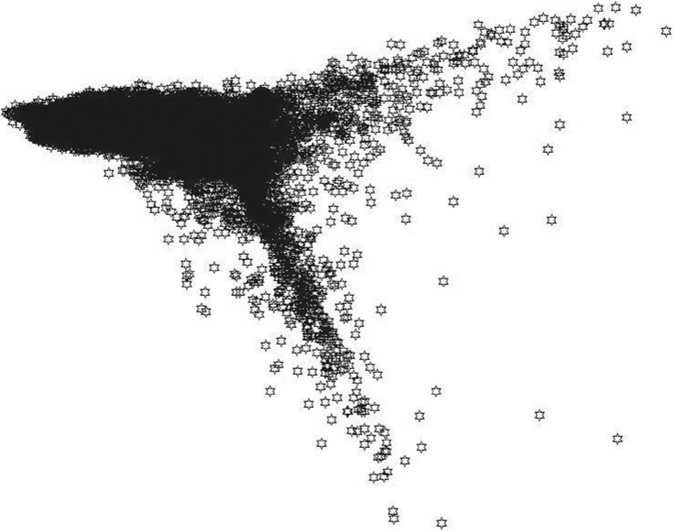
Figure 5.1 Global similarity among RMS incident records
of all records. Typical records will be placed centrally (because they resemble other-typical records), and so the most unusual records are placed extremally.
A greater benefit conies from understanding what these clusters represent: why a particular incident record lies in a particular place. To achieve this, the basic clustering can be overlaid with greyscale coding based on the values of any single attribute, with the shading representing the magnitudes of the values. Thus, an attribute that has no correlation with the global similarity structure will produce an image where the grey variation is randomly distributed, while an attribute that is associated with the structur e of the global clustering will have regions of light or dark.
The meaning of this clustering can be seen most directly by considering the overlay of RUCR codes, as shown in Figure 5.2.
Larger values of these codes correspond to general information and vehicle reports: lower numbers to more serious crimes. Thus, we conclude that serious crimes are associated with the two long aims, while lesser crimes and routine interactions between police and citizens are associated with the left-hand arm/cluster.
Further understanding of the clusters comes from overlaying attributes such as object-of-theftl (a theft of a single object) which shows that the downward cluster is associated with crimes such as thefts. Overlaying the attribute object-of-theft2 (a theft of two objects) shows that the incidents lower in the arm (i.e., more extremal) are associated with more complex thefts (Figures 5.3 and 5.4).
ruer
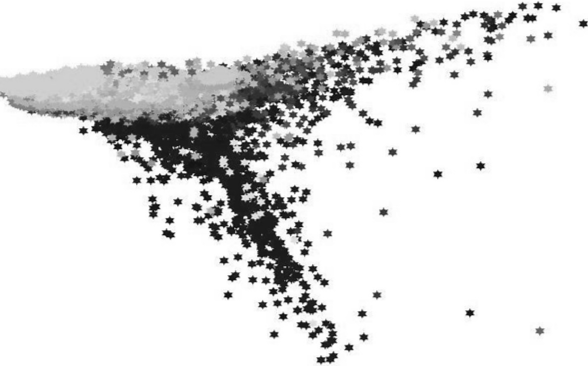
Figure 5.2 Crime codes (RUCR) overlaid on global similarity
object-of-theft2
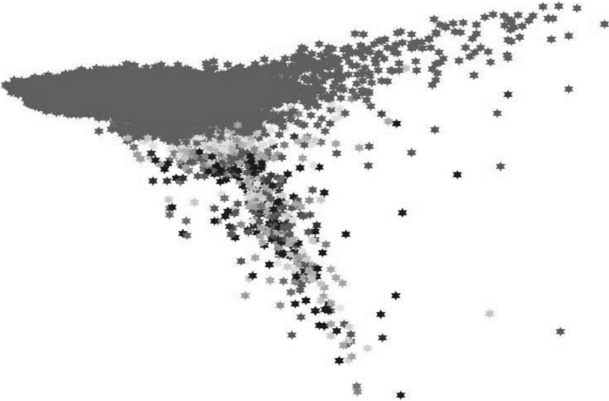
object-of-theft1

Figure 5.4 Overlay of all thefts
Overlaying the offence attribute shows that there is an association between the offence committed and all of the other attributes of each record. The cluster up and to the right contains incidents involving multiple offences. Points furthest to the right are associated with four or five offences in a single incident (Figure 5.5).
Weapon status shows a similar pattern - incidents involving weapons are associated with the top right-hand cluster (Figure 5.6).

