Administrative attributes
The relationship between temporal properties and incidents, especially violent incidents, can also be detected from the clustering.
We fust show the clustering overlaid by day of the week in Figure 5.7. The relationship is at best weak - perhaps the shading distribution in the upper right ami is slightly different to the rest of the figure. Hence there is little difference in the pattern of incidents occurring on different week days.
The overlay of tune of day can also be computed. Here there is a temporal pattern - the darker central points correspond to apparently minor crime-related incidents that occur at a particular time of day (Figure 5.8).
Other administrative associations in the clustering can also be observed. The founded attribute is associated with what investigating officers conclude were
offence

Figure 5.5 Overlay of offence codes
weapon-status

week-day
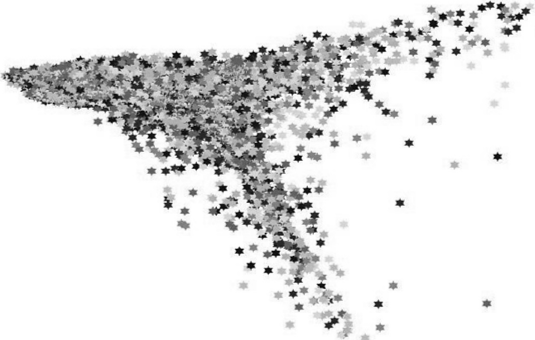
Figure 5.7 Overlay of day of the week
occ-time

founded

Figure 5.9 Crime clearance for each incident
actual crimes. Figure 5.9 shows that these appear in the two right-hand arms; those in the left-hand arm are either reports for which an actual crime cannot be identified or incidents not associated with a crime, such as vehicle accidents.
The overlap of unit-idl (identifying the first unit dispatched to an incident) (Figure 5.10) shows that there is no dispatch for many thefts.
Similarly, priority (Figure 5.11) is associated with the extremal incidents to the upper right and lower left, showing that dispatchers are appropriately prioritising incidents involving more serious crimes. The small dark clusters represent the records associated with reporting traffic accidents.
Of particular interest is the ability to recognise mental-health incidents, preferably before officers arrive at the incident. A mental-health attribute was constructed from the existing data using appropriate RUCR codes; the result is shown in Figure 5.12.
The incidents for which the mental health attribute applies form a tight cluster, tighter than the clusters associated with other kinds of incidents, and so are clearly similar in other ways than simply how they are coded after the fact. This offers the potential to build a predictive model that could warn responders when they are dispatched to a possible mental health call.
Geographical distribution
We now consider the overlaying of attribirtes on a geographical rendering of Kingston, since each incident is geotagged. The following figures show that there is no bias or preference in service based on region within Kingston.
unit-id1

Figure 5.10 First unit dispatched to each incident
priority

mental-health

Figure 5.12 Incidents involving mental health are globally similar
The case-class overlay (Figure 5.13) shows that crimes are distributed uniformly across the region, although there are (not surprisingly) small, local tendencies to clump.
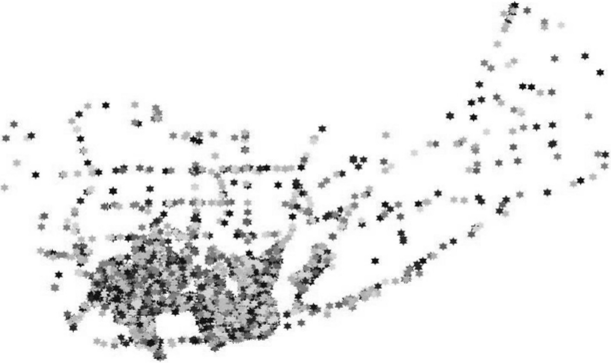
Similarly, the distribution by day of the week and by time of day (Figures 5.14 and 5.15) shows no strong patterns.
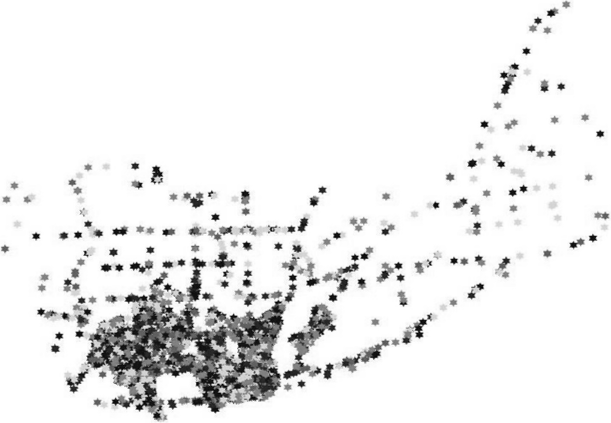
Priority of response (Figure 5.16) also shows no geographical patterns, so there is no a priori bias to service particular areas.
Complainant sex and date of birth (Figures 5.17 and 5.18) also show no indication of bias along these lines by region of the city.
These results demonstrate, empirically, that the Kingston Police deals with incidents and locations in a fan and unbiased manner. The ability to demonstrate, empirically, that police forces are responding appropriately is an important benefit of this approach, allowing forces to demonstrate to then oversight bodies, and the general public, that they are performing well.
Focusing on criminal incidents
The hill range of incidents includes many that are not associated with crimes. A clustering using a smaller number of attributes, focusing mainly on crimes themselves, has a similar structure, but patterns associated with thefts and violence become clearer.Figure 5.19 Global similarity among incidents involving crimes
case-class

Figure 5.13 Type of incident overlaid on Kingston’s geography
week-day

at-scene-time

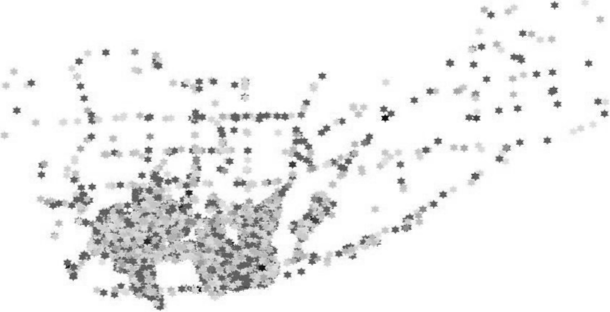
Figure 5.15 Response time to incidents overlaid on geography
priority
comp-sex

Figure 5.17 Complainant sex overlaid on geography
comp-dob

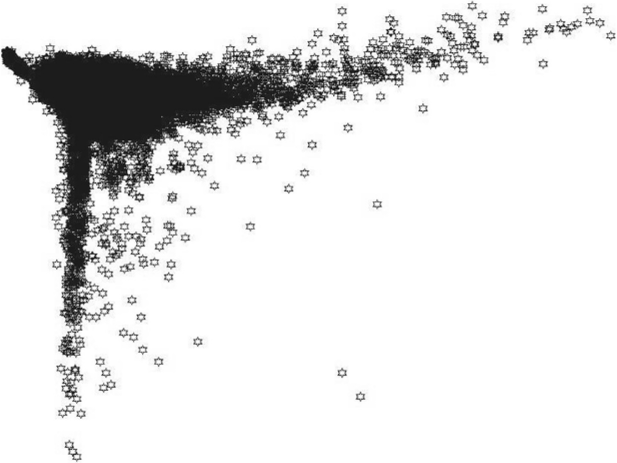
Figure 5.19 Global similarity among incidents involving crimes
The view in Figure 5.19 corresponds to a view of the previous clustering from its right-hand side: the lower arm corresponds to thefts, the right-hand ami corresponds to complex incidents, with the other previously seen structures occluded into the plane of the image. From this view, two properties are apparent. First, there is a strong association between incidents with weapons, incidents with multiple charges, and incidents with multiple unit responses (Figures 5.20-5.22) which is expected but shows that appropriate dispatch decisions are being made.
Second, some apartments are disproportionately involved in incidents of theft and violence (Figure 5.23). There are points corresponding to apartment incidents down and to the right compared to other incidents in the same general part of the figure, and there are relatively more of them in the violent incident ami. Since apartment numbers are included in the data, it is also possible to conclude that the apartments that are disproportionately involved are those with low numbers. They are thus either in smaller buildings (which predominate in higher crime regions of the city) or they are more accessible (criminals prefer not to access the higher floors of high-rise buildings). That multiple incidents of theft are concentrated for some apartments is a finding that is consistent with the literature.

