III Specific Issues and Populations
16
Training Monitoring
Mark R. Homer and Charles R. Pedlar
Highlights
- • Monitoring tools allow runners to estimate the point on the fatigue-recovery-compensation curve that they are on, and therefore determine whether long-term training stimulus is inadequate, appropriate or potentially damaging.
- • Basic tracking of training load (volume, intensity, frequency) with metrics such as distances/durations, training impulse, rating of perceived exertion, blood lactate and heart rate should form the basis of consistent monitoring.
- • Subjective monitoring tools, such as a strong coach-athlete relationship, mood profiling and perceived stress, can be as effective as objective physiological measures at detecting changes in acute and chronic training load; however, it is important responses are accurate, honest and recorded consistently.
- • Female non-hormonal contraceptive users are encouraged to track their menstrual cycle length to provide an indication of adequate energy' intake.
- • Blood and saliva biomarkers offer an objective means of monitoring the physiological response to training load and recovery'; however, these should be taken regularly and interpreted with suitable expertise to ascertain ‘normal’ variation for individual athletes.
- • Decisions on when to use monitoring tools should consider factors such as the point in the training programme when measures are taken, the degree of disruption caused, cost and whether measurements can be taken reliably.
Introduction
Following the First World War, running training underwent an accelerated evolution. Pioneers like Paavo Nurmi and his Finnish colleagues blended increasing volumes with interval training on their way to dominating middle- and long-distance running at the Antwerp and Paris Olympics of the early 1920s. Nurmi trained and raced with a stopwatch in his hand in order to pace his running and distribute his effort equally. No doubt this also helped him to monitor the short- and long-term effects of his training as he prepared for performance. This is arguably one of the first instances of athletes using an external variable to inform their running. Now, the handheld-stopwatch has been replaced with a powerful wrist-borne computer with more processing power than the Apollo 11 control room that successfiilly guided men to the moon and back. We now have the ability to monitor both internal and external metrics of training load and health to comprehensively quantify the responses to discrete and extended phases of training.
This chapter will initially discuss why monitoring is important, and the principles that can be followed in order to use monitoring effectively in a running context. It will then delve into the various types of monitoring tools available to athletes and coaches including heart rate monitoring, blood lactate, rate of perceived exertion, sleep, menstrual cycle, blood biomarker and questionnaires. It will provide advice on how to include them in a periodised programme. Finally, it will explain the potential pitfalls in a now-crowded running technology market and what the future may hold as hardware/software applications, sports science techniques and data analysis continually evolve. We will focus on markers of health, training and physiological adaptation. It is beyond the scope of this chapter to discuss more technical running components such as gait analysis.
Why Monitor?
The benefit of a training stimulus is related to its dose. Too little and there will be little-to- no effect, too large and the influence may be damaging rather than beneficial (Figure 16.1a). Athletes must train in the ‘Goldilocks zone’ where volume (duration and intensity) must be ‘just right’. This is dependent on several factors, including the aim of the training session, the level of athlete fatigue and psychological factors, to name a few. Borrowing a term from the world of toxicology, the theory of hormesis explains how the benefit of a substance (i.e. training) is related to its dose (reviewed by Calabrese, 2018). In theory, administering the optimal dose appears simple, but the variables that affect an athlete’s responses to training are individual, varied and constantly changing - making hormesis a moving target (Peake et al., 2015; Pingitore et al., 2015).
The primary goal of any training programme is to improve performance while protecting (and potentially enhancing) the physiological and psychological well-being of an athlete. Responses and adaptations follow the well-reported (if oversimplified) general adaptation model (Figure 16.1b) where a training stimulus is followed by a period of fatigue and adaptation to allow the body to better cope with the demands of subsequent exercise. Through progressive overload, adaptation leads to improvements in the determinants of running performance (Figure 16.1b, example A). Conversely, a weak stimulus that fails to cause adequate fatigue, coupled with excessive recover)', will not provide sufficient overload and result in a stagnation or regression in performance (Figure 16.1b, example B). An excessive stimulus, with insufficient rest, will not allow supercompensation and result in under-recover)' and further complications in time, if not addressed (Figure 16.1b, example C). There are several ways in which monitoring tools can be utilised to assist decision-making in this process, described here.
Record Keeping
Fundamentally, tracking training load (duration, intensity and frequency) provides quantification of what an athlete has actually done. This is the starting point for any analysis or discussion before any detail or nuance is added. It allows for simple comparisons to be made
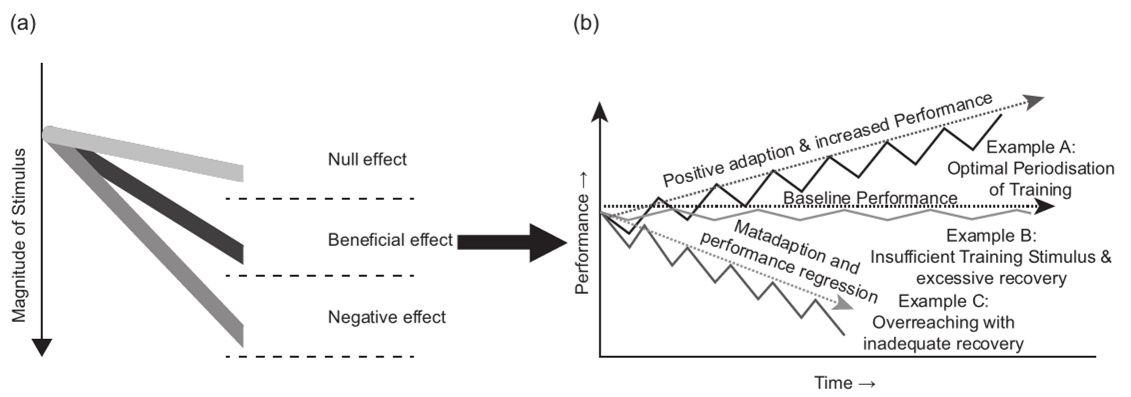
FIGURE 16.1 The acute and chronic hormetic response to exercise training. Monitoring can help identify which trajectory the athlete is following between phases of a programme for different individuals or season-to-season changes. Data collection should be consistent and accurate to facilitate analysis. Incomplete data sets can render comparisons useless, and any changes made should align with historical information.
Accurate Delivery of a Prescribed Programme
By adding additional metrics such as zone distribution (via speed, heart rate, rating of perceived exertion [RPEJ, etc. detailed later in this chapter) the coach or athlete can compare planned training with executed training. This is an important distinction that should not be taken for granted - regardless of whether a programme is considered to be working or not. A major predictor of athlete success is the completion of the planned training programme (Raysmith and Drew, 2016). If a programme has not been followed with some degree of completeness, it is difficult to make evidence-based changes to future iterations of a programme.
Reducing Guesswork and Bias
Through consistent monitoring, coaches and athletes can reduce the risk of confirmation bias, the tendency to look for information that supports previously held beliefs. Considering all potentially confounding variables allows for changes in performance to be explained accurately. For example, wind conditions may have a significant effect on a training effort and should be incorporated into the analysis of split times. Ignoring such information could result in misjudging progress (positively or negatively).
Avoiding Injury and Illness
Much of the recent focus of training load monitoring, particularly in team sports, is related to minimising the training that is lost to injury and illness, with the ultimate goal of predicting such incidences in order to manipulate programmes to avoid them. In a group of 33 international track and field athletes, monitored over a 5-year period, (Raysmith and Drew, 2016) demonstrated that completing 80% of planned training weeks led to a seven-times higher probability of achieving a performance goal, and training availability accounted for 86% of successful seasons.
Calculation of acute and chronic workload ratio (ACWR; Gabbett, 2016) in order to balance training-phase to training-phase changes in volume and intensity have become popular in some sports; however, this has yet to be rigorously tested in a distance running setting. The ACWR can be applied to running training with relative ease due to the reduced variables at play in comparison to sports with a larger range of training modalities. It is widely accepted that sudden or abrupt changes in training load should be avoided, and this metric may provide an objective means of avoiding large step changes that may increase the risk of injury (Gabbett, 2020).
Research and Development
The effectiveness of novel interventions is difficult to quantify in an athletic environment. The number of confounding variables that can affect performance, such as current training load, sleep, mental fatigue, etc., make attributing the effect of different variables difficult. A routine training monitoring approach can be used to isolate the impact of a new piece of equipment or performance supplement. For example, a reduced heart rate and rate of perceived exertion at a given running speed, with a new intervention applied, would provide evidence of efficacy.
How to Monitor
Having discussed why we monitor factors affecting running performance and some principles that should underpin the process (see Table 16.1), we now consider the tools available to a coach or athlete to collect relevant information related to running performance.
Subjective vs. Objective
Monitoring can be subjective (e.g. a reflection of an individual’s feelings or opinions), objective (quantifiable data) or a combination of the two. Subjective data have long been a tool of
TABLE 16.1 Principles of monitoring
|
Principle |
Considerations |
For example |
|
Accuracy |
How close to the actual value is the measurement you have made? |
A GPS watch will not always record the length of a 400 m running track accurately. |
|
Validity |
How does the monitoring tool relate to performance? Is what you are monitoring a determinant of performance? |
A lower heart rate at a given running speed suggests improved running economy, a variable known to be a determinant of endurance running performance. |
|
Reliability |
How repeatable is the result of the measurement you have made? |
If you measure blood lactate in the same way several times, you will expect a certain variability in the result. This variability needs to be acceptable for the measurement device to be deployed. |
|
Consistency |
Are you controlling related variables to isolate what you want to measure and attribute change to it? |
Time of day Running surface and footwear Weather conditions (temperature, humidity wind) |
|
Discretion |
Athletes may react differently if they are being ‘tested’. |
Heart rate may increase if an athlete is anxious about being tested. |
|
Time frame |
What is the time frame for the period of monitoring? Set a time frame for a monitoring intervention. Stop and review. |
Monitoring an athlete through several microcycles of training will likely yield improvements in the variables measured, but these cannot go on improving forever. Planning monitoring over a set number of microcycles avoids stagnation. A variable such as sleep quality need not be measured continuously if sleep quality is good. |
|
Targeted |
Can you isolate key variables that are determinants of health and performance? |
A routine blood test provided by a general practitioner might not measure variables related to athlete performance. |
|
Analysis |
How you are interpreting the information you are collecting? Are you using appropriate statistical analysis? Are changes in your data meaningful? |
If the change in blood lactate measured on two separate occasions is not greater than the measurement error of the device, it may not be a meaningful change. |
the coach whether consciously or not. An understanding of individual athletes’ behavioural responses to a stimulus can be used effectively to monitor and adjust training load. Examples can range from a coach using their relationship with the athlete and their experience to assess mood and asking ‘How do you feel?’ to structured, more formal questioning. At the risk of stereotyping, sport scientists are more comfortable at the more quantifiable end of the subjective-objective data continuum, where reassurance is found in numbers and facts rather than in feelings and emotional responses.
Objective data are generally more straightforward. The collection of quantifiable data allows for a more ‘black and white’ approach to analysing progress and change. In the academic world, statistical measures of ‘significance’ have traditionally been used to assess the likelihood that a change or difference is due to chance, rather than a true difference in outcome between groups or interventions. While useful for large groups in clinical conditions to report ‘trends’, such tests are reliant on average data and can be misleading in their clear-cut ‘difference or no difference’ reporting methods.
Cross-over exists between subjective and objective monitoring. The use of objective questionnaires requires athletes to provide quantifiable scores for markers of health and recovery. In a systematic review of objective and subjective measures of athlete well-being, changes to acute and chronic training load were detected by markers including mood disturbance and perceived stress more sensitively than immunity, inflammation and muscle damage measures with little consistent association between the two types of assessment (Saw et al., 2016). The following section highlights some key objective and subjective markers and their strengths and limitations.
Individual Variation and Statistical Considerations
In athletic performance (and many other fields), individuals respond differently to stimuli. A programme that works well for one runner may be less effective for another and be detrimental for somebody else. The same goes for recovery, elements of nutrition and the myriad of related interventions available to athletes. Therefore, it is important to look beyond the average response and examine the variation within it.
When scrutinising athlete data, it is important to consider what the smallest meaningful or worthwhile change in a variable is, and account for the measurement error of a monitoring tool alongside it. Some equipment has a higher test-to-test variability than what would be considered a worthwhile change in a metric, suggesting that differences in results cannot be attributed to improved performance.
For example, a handheld blood lactate monitor (discussed in the next section) with an overall measurement error of 3% could report an actual value of 4 mMol.L 1 as anywhere between 3.88-4.12 mMol.L-1, with this range growing as the lactate value increases (e.g. at 10 mMol.L-1 the range could be 9.7-10.3 mMol.L-1). Such variation could mask a meaningful change in the blood lactate response to exercise and affect the identification of thresholds used to prescribe training intensity and track adaptation. More ‘reliable’ errors do exist that lead to equipment consistently over or under reporting a result.
Specific Monitoring Methods
This section covers specific monitoring tools that can be used to quantify training, recovery and general athlete health. A range of objective and subjective markers are discussed.
Volume and Intensity
The total training load experienced by runners comprises volume (duration or distance) and intensity. The physiological impact of a given training mileage (volume) at a high intensity will be markedly different to the same mileage at a lower intensity. Ground reaction forces increase linearly with running speed, resulting in greater musculoskeletal damage, and metabolic rate is higher at faster speeds, resulting in greater substrate use. The increase in substrate use is non-linear and causes an exponential rise in blood lactate with a linear increase in exercise intensity. Attempts have been made to derive a single summary statistic that captures total load, and the most well established is the TRaining IMPulse (TRIMP), which is the product of time and intensity (typically measured with heart rate). The original TRIMP formula accounts for the non-linear increase in blood lactate (Banister et al., 1991) by using intensity zones, to avoid a disproportionate weighting from lower intensity exercise, using the following formula.

An individualized TRIMP (iTRIMP) that was specifically validated in runners (Manzi et ah, 2009) moved away from using average heart rate and fixed constants in the calculation, replacing them with values derived from an individual runner’s plotted lactate curve (see section below) to create a more precise iTRIMP value. Greater weekly iTRIMP values were related to greater improvements in running speed at fixed blood lactate values, 5,000 m and 10,000 m running performance (Manzi et ah, 2009).
Rating of Perceived Exertion (RPE)
The runner’s perception of effort is perhaps one of the most informative data points possible, since the brain is adept at bringing together myriad internal signals to judge effort. A scale of Rating of Perceived Exertion (RPE) is a well-established tool for quantifying effort at any point in time. Typically two versions are used: the 6—20 scale (Figure 16.2) or the 0-10 scale (Borg, 1982). The RPE scale has been comprehensively validated. It predicts time to exhaustion well across a range of environmental conditions (Crewe et ah, 2008).
To summarise complete training sessions with a single RPE rating, the ‘Session RPE’ (sRPE) provides a useful single value to summarise the overall effort required. However, it is important to note that sRPE can vary between individuals, and several factors can influence this score including the time after the session that sRPE was recorded, the method of recording (paper vs. electronic tool), and the gender of the runners (Roos et ah, 2018). Therefore, applying the principle of consistency (see Table 16.1) is critical.
Global Positioning Systems (GPS)
GPS integrated into wrist watches and smartphones, combined with tracking apps, have revolutionised monitoring of running distance and speed over the past decade, with 90% of regular runners reported to use GPS in the USA (Moore and Willy, 2019). Devices have been shown
256 Mark R. Homer and Charles R. Pedlar

FIGURE 16.2 Borg’s 6—20 Rating of Perceived Exertion scale Source: Borg (1982).
to be accurate when tested over half-marathon and marathon distances, with greater accuracy reported for wrist-worn devices as opposed to smartphone devices (Pobiruchin et al., 2017). GPS devices facilitate the assimilation of data into software platforms and have revolutionised the ease with which runners can monitor a host of metrics and easily share them with others.
Heart Rate
As a determinant of cardiac output, heart rate monitoring provides an indicator of cardiovascular workload. With successful adaptation to training, a lower heart rate will be evident at a comparable speed (or a faster speed for a comparable heart rate), as a clear indicator of improved running economy. Heart rate is also increased in the presence of several other stressors, including psychological stress, thermal stress and the presence of illness. Additionally, there may be some fluctuation in heart rate according to circadian rhythm (time of day) or stage of the menstrual cycle. Therefore, heart rate provides a global physiological ‘stress’ marker.
Chest strap heart rate monitors are well established as an accurate means of measuring heart rate during running. A word of caution: the interval between heart beats (the R-R interval) varies continuously, and the heart rate displayed by a device is a calculated value that may vary by device and according to settings; for example, a 5 sec average vs. a 30 sec average. When monitoring an athlete and comparing data across time, the same devices should be used and the settings kept consistent. Recently, wrist-worn heart rate sensors have become popular as they provide a convenient alternative to the chest strap; however, this comes with a loss of consistency (Pasadyn et al., 2019).
Some key terms to be aware of in heart rate monitoring:
- • Resting heart rate: the number of heart beats per minute at rest, not affected by recent exercise. This is commonly measured upon waking.
- • Maximum heart rate: the highest heart rate achieved by an individual during an incremental exercise test, typically lasting between 12 and 20 minutes.
- • Heart rate reserve: the maximum heart rate minus the resting heart rate.
The variability in heart beats per unit of time as a measure of autonomic nervous system function is used to assess the response and adaptation to training stimulus (among other stimuli). In simple terms, Heart Rate Variability (HRV) is a measure of the balance between sympathetic (stress or ‘fight or flight’) and parasympathetic (relaxation or ‘rest and digest’) nervous system control. Chronically increased HRV is indicative of parasympathetic tone and associated with increased recovery, while chronically decreased HRV suggests increased stress and potential maladaptation.
Research suggests that HRV can be used to monitor and predict training adaptation in runners (Vesterinen et al., 2013). This can subsequently be used to inform the training process in order to maximise adaptation if interpreted correctly. However, the use of HRV as a marker of overreaching is less well supported (Bellenger et al., 2016). Once restricted to electrocardiogram (ECG) measurement, HRV monitoring is now a standard feature of heart rate monitors and available via smartphone applications, although care should be taken to ensure that tools have been validated before incorporating their use into daily practice.
Blood Lactate
The concentration of lactate in the blood has been used to assess the physiological responses to exercise since the 1970s. Previously reserved for exercise physiology' laboratories, advances in technology' have led to field-based tests using relatively inexpensive handheld lactate analysers. Blood lactate is an essential by-product of carbohydrate breakdown to produce energy within muscle cells. Far from being a waste product, lactate play's a key role in recycling glucose and regulating substrate utilisation (Brooks, 2018).
Lactate production increases with exercise intensity' as muscle fibre recruitment increases - particularly the carbohydrate hungry fast-twitch fibres. This accumulation is actually in response to an increase in muscle cell acidosis caused by the build-up of hydrogen ions resulting from the splitting of large amounts of adenosine triphosphate (ATP) to produce energy, rather than the cause. Therefore, concentrations of blood lactate are an ‘indirect’ marker of energy' system contribution and the associated muscle cell acidosis. Directly measuring hydrogen ions in the muscle is invasive and time consuming, requiring a muscle biopsy', and is therefore not suitable for routine athlete monitoring. Blood lactate can be assessed in seconds by the analysis of a pin-prick capillary blood sample and offers a practical surrogate solution.
Lactate can be used to inform training in two major ways. Traditionally, the curvilinear response of blood lactate (as with ventilatory markers) to increasing exercise intensity' is used to identify' thresholds that signify the transition between exercise intensity domains with different physiological responses (moderate, heavy and severe). These are used to prescribe training intensities, monitor adaptation and predict performance (Newell et al., 2015). A wide range of lactate indices are commonly used to test athletes (see Chapter 6). As a monitoring tool, blood lactate testing has been incorporated into regular training sessions as a means of monitoring the responses to different training intensities. This allows coaches and athletes to make ‘in session’ interventions to maximise the responses to individual sessions and monitor adaptation over time.
Various tools are available to collect, analyse and process blood lactate information. For a coach in the field, handheld analysers provide almost immediate feedback. Note that data derived from handheld lactate analysers can differ considerably from benchtop analysers, so the data should not be used interchangeably (van Someren et al., 2005). Calculation of exercise thresholds such as the lactate turnpoint can be complex and open to interpretation. However, several tools are now available that calculate parameters using established algorithms based on raw speed, lactate, heart rate and oxygen consumption (if available) data. As with all capillar)' blood sampling, it is essential that proper procedures are followed to ensure safety, and therefore, it is recommended that a sport scientist qualified to work with blood samples oversees this process.
Critical Speed
As discussed, training intensities derived from laboratory-derived oxygen consumption and blood lactate thresholds are widely used to prescribe and monitor load in runners. The concept of critical speed has more recently been utilised to identify the highest sustainable oxidative metabolic rate using the relationship between running speed and the duration for which it can be sustained (Jones et al., 2019). As a monitoring tool, critical speed can be used to assess changes in endurance and high-intensity exercise capacity (Pettitt and Dicks, 2017). See Chapter 6 for more details on measurement and interpretation of a runner’s critical speed.
Body Composition
Body mass and body composition are important determinants of endurance running performance. In a longitudinal analysis of marathon performance, Marc et al. (2014) identified a decrease in morphological indicators such as body mass and body mass index (BMI) associated with faster marathon times over a 10-year period. This is primarily attributable to the influence of body mass on running economy and the influence of body fat on thermoregulation. However, it is important to note that a lower body mass and BMI increase the risk of relative energy deficiency in sport (RED-S), where the balance of dietary energy intake and energy expenditure is compromised and physiological function is diminished - causing disruption to metabolic rate, bone health, immunity and menstrual function (amongst other systems) (Mountjoy et al., 2014). Chapter 18 explores the RED-S syndrome in further depth.
Monitoring body composition is therefore important, but the implications of timing, interpretation, feedback and interventions must be carefully considered. To increase the accuracy and reliability of data, measurements should be consistently taken on waking, fasted and following a toilet visit. Several tools exist to monitor the composition and distribution of body tissue that vary in their practicability, expense and accuracy (Ackland et al., 2012).
Sleep
Sleep is a fundamental process for the maintenance of health and has been widely recognised as a priority for optimum recovery in athletes. The sleep state is characterised by cyclical hormonal and antioxidant variations that facilitate recovery. Endurance athletes may require slightly more sleep than non-athletes; however, there is wide individual variation and no magic number for sleep requirement (Gupta et al., 2017), and some studies have reported poor sleep in athletes compared to healthy controls (Leeder et al., 2012a).
Monitoring sleep is something of a minefield. In order to measure sleep accurately, the gold standard method is polysomnography measured in a sleep laboratory. Various sleep monitoring devices exist that attempt to derive similar information by less cumbersome methods, but at the expense of accuracy and precision. Wearable sleep devices tend to underestimate sleep disruptions and overestimate total sleep time and sleep efficiency. Halson (2019) comprehensively reviewed approaches to sleep monitoring in athletes.
For the distance runner, sleep can be disrupted by travel schedules, altitude, physiological and psychological stress. Monitoring sleep can help to identify a clinical sleep disorder, in which case the athlete should be referred to an appropriate health care professional. There is a risk with sleep monitoring that the athlete becomes worried about the data, and this impacts upon sleep quality! A prudent approach, therefore, might be to establish if sleep is broadly sufficient over a single micro-cycle, then cease the routine monitoring.
Menstrual Cycle
The female menstrual cycle is characterised by significant fluctuations in female hormones, and the most well-known of these are oestrogen, progesterone, luteinizing hormone and follicle stimulating hormone. It has been known for decades that the distinct phases of the cycle can have a significant impact upon aspects of sports performance (Reilly, 2000). The menstrual cycle is strongly influenced by energy' availability, such that during phases of heavy training where an energy' deficit is more likely, the normal fluctuation in hormones becomes lost. Extended periods with an absence of menstruation are associated with poor bone health (increased stress fracture risk) and a host of other negative outcomes, encapsulated in the RED-S framework (Mountjoy et al., 2018a). It is desirable, therefore, for a female athlete to maintain a regular menstrual cycle, since it is a strong indicator that energy availability is adequate to support training and adaptation. Thus, monitoring the menstrual cycle gives an indication of adequate energy availability to support adaptation to training (see Chapter 18).
Approximately half of all female athletes have a ‘normal’ menstrual cycle with wide individual variability' in the magnitude and impact of fluctuating hormones. Several physiological systems are influenced by these fluctuating hormones. Menstrual cycle symptoms can vary according to the phase of the menstrual cycle and can vary in severity and frequency. In some cases, symptoms can be debilitating and lead to athletes missing training. Tracking symptoms and seeking advice on how to combat these symptoms may therefore be a valuable exercise to help athletes complete their training. Chapter 20 discusses these issues in further detail.
Blood and Saliva Biomarkers of Health
Certain biomarkers lend themselves to monitoring recovery status in athletes, offering an objective tool to help inform training decisions. Identifying short- and long-term trends in biomarker data can help athletes and coaches to balance training load with recovery, maintaining an appropriate hormetic stimulus (see theory of hormesis, described earlier in this chapter), i.e. when to push on and increase training load versus dialling back and focusing on recovery.
Several biomarkers are available for point-of-care testing, using either a small capillary blood sample or saliva sample. These include creatine kinase as a marker of acute muscle damage; c-reactive protein as a marker of inflammation; urea as a marker of protein catabolism, redox biomarkers such as hydroperoxides; and hormones such as testosterone and cortisol. It is important that these biomarkers are measured consistently with an appropriate degree of scientific rigour, for example, standardising the time of day when the samples are collected and ensuring the samples are drawn and processed by a competent technician. An exhaustive list of considerations is beyond the scope of this chapter, but these are covered in some detail by Pedlar et al. (2019).
A word of caution with blood biomarker monitoring: biomarkers should be considered alongside subjective, behavioural and performance information to assist with decision-making. Athletes are often outliers, and we expect to see different data from the general population. For example, with endurance training, fluctuations in plasma volume according to training volume are likely, which influences the haematocrit and haemoglobin results. Establishing what is ‘normal’ for each athlete is important; see Pedlar, Newell and Lewis (Pedlar et al., 2019), in order to establish individual thresholds. This is the same theory applied in the Athlete Biological Passport, where an individual ‘normal’ range is established over several observations.
Psychological Status
The value of subjective markers either in unison or in contrast with objective monitoring has been discussed. The Profile of Mood States (POMS) and the Recovery-Stress Questionnaire for Athletes (RESTQ) are two of the more established tools in this field, although others such as the Multi-Component Training Distress Scale (MTDS) and Daily Analyses of Life Demands of Athletes (DALDA) do exist. Also, much simpler methods are often used in the field that have the advantage of brevity but lack depth.
The POMS questionnaire (McNair et al., 1971) requires athletes to respond to a list of words using a Likert scale based on their current feelings. Words are associated with six main emotional states: tension, depression, anger, vigour, fatigue and confusion. A profile is produced to assess changes to the mood state over time. Since its development in 1971, POMS has been used extensively in sport and adapted for length and age of participant in recent years. Several studies have demonstrated a relationship between training load or performance and mood disturbance scores (Beedie et al., 2000). Online tools are available for athletes to self-monitor their mood (Lane and Terry, 2016).
The RESTQ-36-R-Sport is a shortened version of the original RESTQ-Sport questionnaire (Kellmann and Kallus, 2001). It is divided into 12 subscales with 3 ‘Likert scale’ questions for each. Three sub-scales relate to general stress, three to sport-related stress, three to general recover)' and three to sport-related recovery covering physical, emotional, behavioural and social factors. These divisions allow for a detailed analysis of an athlete’s psychological status, and the questionnaire has been effective in monitoring individuals and teams. A comprehensive analysis (Saw et al., 2016) suggested that the questionnaire was responsive to changes in both acute and chronic training load.
When contemplating a measure of psychological status, a coach or athlete must consider whether a particular tool has been designed for use with athletic populations. Saw et al. (2016) suggest that tools designed for such use are more effective than generic questionnaires. Also, it is worth considering the timing of administration and any burden this places on an athlete. It may be appropriate to use short and simple tools daily that can assess acute changes in status. Anecdotally, the authors have had have found it useful to use daily changes in the response to Likert scale questions including ‘readiness to train’, ‘perceived shape’ and ‘recovery from previous day’s training’ administered as part of a morning monitoring test battery in order to assess recovery. Longer more detailed questionnaires such as POMS or RESTQ can be used less frequently, e.g. at the end of training cycles to assess the responses to chronic training.
Monitoring Distribution
Having discussed the why, how and what of useful monitoring for running, it is now worth considering the when. Figure 16.3 provides an example of the previously discussed methods of monitoring and how they could be distributed during an example training programme. This timing of monitoring tools depends on several factors, and monitoring should be organised around key milestones in a training programme. Baseline data should be collected and repeated around key interventions including training camps and competitions. The degree of disruption caused by interventions is a necessary consideration. For example, a full laboratory testing profile or haematological analysis can be informative and influential. However, they can also be expensive, time consuming and disruptive to training. A balance must be struck, and such tools used sparingly to avoid impacting on competition preparation.
The sensitivity of a measure influences how often it should be used. For example, as discussed, waking heart rate is a sensitive measure of the accurate response to training which can vary daily. Daily monitoring can encourage acute changes to training in response to fluctuations. In contrast, some measurements can vary due to the influence of extraneous variables. Body weight, for example, can differ by approximately 1 kg on consecutive days due to variations in diet, hydration, menstrual cycle and travel. Monitoring body weight daily and calculating a rolling 5-day average can account for such variation and allow coaches and athletes to account for the ‘noise’ of misleading individual changes.
ATHLETE CASE STUDY PERSPECTIVE
Andy Baddeley: Olympic finalist (1500 m) and parkrun world record holder
Training monitoring formed a crucial part of my programme when I was competing at my peak. I was lucky enough to have access to top-class physiology support, and my coach and I integrated this into our plan. There were two elements of monitoring that were the most useful for me, namely outdoor lactate testing during my threshold runs, and routine blood testing.
I used the data from lab-based lactate profiling to guide my heart rate zones for my threshold runs, but owing to my gait, I always found that treadmill running didn't accurately reflect my true physiological response to 'real' outdoor training. To this end, my outdoor threshold runs were monitored by taking blood samples before, during (every 2 miles) and after my 6-mile threshold runs. These weekly runs are one of the things that I feel contributed most to my success. I learnt to effectively 'feel' my threshold, and there were periods where I could accurately gauge intensity to within a single BPM without looking at my HR monitor.
This monitoring allowed me to push right up to, but crucially not beyond, my lactate threshold - maximising the benefit I was able to take from those sessions. To compound this benefit, they gave me the confidence to know with certainty that I was optimising my training in a way that I knew it was unlikely my rivals were. As a 1500 m runner, I was able to run a 30-minute 10 km at threshold effort by perfectly fine-tuning this process.
My coach and I also used regular blood testing to inform our monthly training plan. I usually worked off a routine with three hard weeks followed by an easier week, but the blood tests helped us to avoid pushing too hard if I was run down, and to bring easier weeks in earlier than we might otherwise have done. There's a very fine line between maximising training benefit and overdoing it, and as an athlete it can be hard to psychologically justify easing back. My coach knew me so well, and honesty was such a huge part of our relationship that he could usually read the signs, but the testing added an extra layer or knowledge to work from.
It's worth saying that I was selective with my monitoring methods, and throughout my career the only runs I did with a CPS watch were those threshold runs. The rest of my easy and steady runs were all run to feel, allowing my body to govern how fast I felt like running. Similarly, on reflection, because I had such extensive data, there were periods where I knew categorically that I was less fit than I had been previously - something that can be tough to deal with psychologically. I would advise all coaches and athletes to bear that in mind, and to use testing selectively, and always with a clear goal. When I knew why we were doing something, I could handle the results and work out a plan to get to where I needed to be. As an example, testing simply to confirm that someone is in good shape, at a critical point in a racing season, runs the unnecessary risk of showing someone they're not quite where they need to be, without the time to do anything about it.
Further Considerations
If any monitoring programme is to be successful, the why, Iww and when factors discussed earlier must be considered in unison. Through working with athletes and coaches at different competitive levels, the authors have experienced some additional factors that have provided the opportunity for further reflection. In the author’s experience, the usefiilness of a monitoring programme is dependent on the athletes perception of how (and if) the data collected are used. Failure to see change based on responses can lead to a reduction in the value an athlete sees in accurately recording information. Poor communication between coach and athlete that fails to explain why, for example, volume or intensity are increased despite fatigue may affect future adherence. It may be that this is what the coach feels is required from a particular block of training, and the athlete must push on to get it done - this must be discussed openly.
Athletes not being honest, accurate or consistent with their subjective ratings can also affect the usefiilness of monitoring information. Not wishing to show weakness in a competitive environment where selection is at stake, the misremembering of information and simply forgetting to record information are all possible scenarios for athletes under extreme pressure for long periods of time. The inability to rely on athlete-generated information can lead some coaches to seek additional objective markers at the expense of their athlete’s subjective feelings, and a damaging cycle ensues.
The lack of agreement that Saw et al. (2016) identified between certain objective and subjective measures can be interpreted as a positive finding. Athletes will not always be able to accurately report the response that leads to the most effective manipulation of their training programme. Fatigue, life-stress and many other external factors could contribute to ratings of perception that may not influence their responses to a training stimulus. This is where objective markers can be useful. If accurate, reliable and valid, physiological markers may not be

FIGURE 16.3 Distribution of monitoring tools influenced by the same psychological variables (although they may be affected by different ones) and allow for an isolated look at individual components of performance.
Objective monitoring brings a different set of threats and opportunities. There are clear benefits of using the quantifiable data that have already been discussed; increased insight, visualisation and granular detail. However, such information also increases the chances of confirmation bias where isolated information is used (either consciously or unconsciously) to support an opinion or viewpoint. The risk of‘cherry picking’ information that supports a particular narrative is not a new concept, or one that is limited to sports performance.
As technology develops and monitoring tools improve, there comes a point where it may be possible to switch sampling methods or replace a metric altogether. This can lead to difficult decisions for the coach or athlete. Changing the way a particular variable is monitored can make it difficult to use historical data for comparison. It can therefore be tempting to resist change, even though it may improve the usefulness of improved methods. This decision should be based on the risk vs. reward of any potential conversion.
As the amount and quality of incoming data feeds increase, the education provided for those attempting to use it has inevitably fallen behind. While the potential for improved performance through detailed monitoring is clear, the pitfalls of more and more information should not be ignored. Coaches need education to help them interpret the data they are now collecting and communicate its relevance to their athletes. The interaction of different variables must be considered, as using metrics independent of each other can be misleading. With this in mind, numerous platforms are available that attempt to provide a single point of contact for athletes and coaches to summarise training and performance. The cost-benefit balance of such systems should be considered, alongside their flexibility. Platforms are rarely sports-specific and may not cater for all monitoring tools that a coach or athlete wishes to incorporate.
Advances in data management techniques allow numerous data sources to be combined and analysed with relative autonomy. This has led to the production of algorithms that calculate multifactorial models of training adaptation and recovery that have become standard features of health and fitness products in recent years. The reliability and validity of these metrics are not fully supported in the literature, but this has not stopped investigation into the next stage of development - the use of machine learning or artificial intelligence to further improve global athletic performance.
The biological nature of athletic data and the inability to incorporate all the variables that affect a result can limit the usefulness of such modelling. This may be a good thing, as the human ability to make decisions should not be lost. Data should be used to inform decisions, not make them. An all-encompassing objective marker that adheres to all the principles of monitoring listed in Table 16.1 does not exist. Therefore, a culture of trust and honesty between athlete and coach is vital to provide as complete a picture of physiological and psychological performance and well-being as possible.
Summary
In the pursuit of continual improvement, runners require a physiological overload (i.e. a training stimulus), which is followed by an adequate period of recovery to allow for adaptations to take place. Judging appropriate training workloads for individual runners, particularly over long periods of time, can be problematic, particularly when other lifestyle ‘stressors’ that also cause physiological perturbations are considered. Monitoring tools provide a means of estimating whether a training dosage has been sufficient to cause a fatigue response (acutely), an improvement (in medium-long term) or a negative overreaching response (in medium-long term). Simply recording training load using the distance/duration of sessions, training impulse and potentially heart rate and blood lactate during sessions should form the basis of monitoring for runners. Subjective monitoring tools can be used alongside these to detect whether an athlete is sufficiently recovered or beginning to show signs of overreaching, assuming that reflections are honest, accurate and recorded consistently. In this regard, the importance of a strong coach-athlete relationship cannot be understated. Objective physiological markers taken from blood and saliva samples also provide an accurate way of monitoring stress and recovery, if measures are taken regularly, and profiles for individual runner are generated. Female non-hormonal contraceptive users are encouraged to track their menstrual cycle as this can provide supplementary information alongside energy intake to support training and lifestyle demands.
17

