Identification of Disease Subgroups and Explainability
Besides predicting a disease label and severity score, our method provides explainability behind the decision. For a given test image and its predicted registration parameters, we calculate its Z2 distance from each of the ten cluster centers to give us a single value quantifying the sample’s similarity with each disease cluster. Let the sample s be assigned to cluster i G [1, 10], and let the corresponding Z2 distances of 5 to each cluster be dt. We calculate a normalized value:

where p(, gives a probability of the test sample reaching the highest severity score. It is also a severity score on a normalized scale of [0, 1], Scores from multiple visits help to build a patient severity profile for analyzing different
Table 14.2 Classification Results for AMD, DME and Normal on the Test Set Using Different Networks
|
Reg-DEC |
VGC 16 |
ResNet 50 |
DenseNet |
DEC |
k-means |
MultCNN (Xie et al., 2016) |
|
|
Sen |
93.6 |
91.7 |
92.5 |
92.6 |
89.5 |
85.7 |
92.5 |
|
Spe |
94.3 |
92.8 |
93.6 |
93.5 |
90.6 |
86.8 |
93.4 |
|
AUC |
96.4 |
94.1 |
95.2 |
95.3 |
91.9 |
87.7 |
95.2 |
|
Time (h) |
4.3 |
16.7 |
12.4 |
13.6 |
2.5 |
0.5 |
15.1 |
Time indicates training time in hours.
factors behind increase or decrease of severity, as well as the corresponding rate of change. The rate of severity change is an important factor to determine a personalized diagnosis plan. pd is different from the class probability obtained from a CNN classifier. The classifier probability is its confidence in the decision, while pd gives the probability of transitioning to the most severe stage.
Tables 14.1 and 14.2 demonstrate Reg—DEC’S superior performance for classification and registration. To determine Reg—DEC’S effectiveness in predicting disease severity of classes not part of the training data, we train our severity prediction network on normal and AMD images only, leaving out the DME-affected images. We keep the same number of clusters (i.e., 10) as before. Since there are no DME images and number of clusters is unchanged, assignment of images to clusters is different than before. In this case, 96.4% of AMD images are assigned to clusters 8-10 which is a drop of 0.8% than the previous assignment, while 96.5% of normal samples are assigned to clusters 1-3 which is a decrease of 1.3%.
We see fewer images in clusters 4-7 although the majority of original assignments of normal and AMD cases are unchanged. When we use this trained model on the DME images, we find that 96.9% of the images are assigned to clusters 4-7, a decrease of 0.9% from before. The above results lead to the following conclusions: (i) Reg—DEC’s performance reduces by 0.9% for DME and maximum of 1.3% (for Normal images) when DME images were not part of the training data. This is not a significant drop indicating Reg—DEC’s capacity to identify sub-groups that were not part of the training data, (ii) Using k-means clustering does not give the same performance levels demonstrating that end-to-end feature learning combined with clustering gives much better results than performing the steps separately. Reg—DEC accurately predicts disease severity even though there is no standard severity grading scale. Severity scale also identifies sub-groups from the population with a specific disease activity.
Figure 14.2 first and second columns, respectively, show AMD images accurately classified by Reg—DEC and DenseNet. The arrows highlight regions of abnormality identified by clinicians. Ellipses (in first column) show the region of disease activity. The length of major axis quantifies magnitude of displacement of the corresponding grid point, and the orientation indicates direction. The local displacement magnitude is proportional to disease severity, while the orientation identifies the exact location. The second column shows the corresponding CAMs obtained from DenseNet (region highlighted). Although the CAMs include the region of
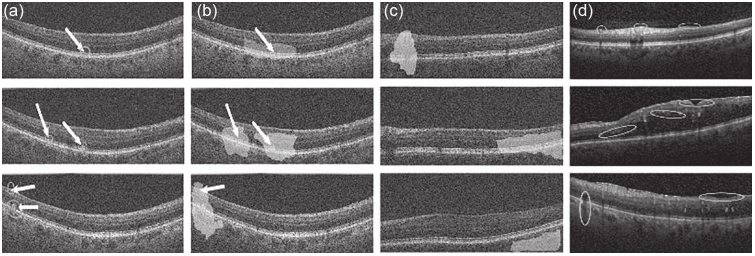
Figure 14.2 Example of misclassified images. White arrows show positions of diseased activity in AMD images, (a) Predictions by Reg-DEC and quantification of disease activity; (b) CAMs by DenseNet; (c) normal images inaccurately classified as AMD by DenseNet with CAMs; (d) DME images correctly classified by Reg-DEC. The circles are proportional to disease severity.
disease activity, it does not localize it accurately and is spread out, nor does it output a measurable value. By dividing the displacement magnitude with the distance between the grid points, we get a value very close to pd. The advantages of our registration-based method are obvious since it pinpoints abnormality and quantifies it in terms of displacement magnitude and angle.
Figure 14.2 third column shows examples of normal images that were rightly classified by Reg-DEC but incorrectly classified as AMD by DenseNet. The shaded regions highlight disease activity as identified by DenseNet, which is erroneous since there are no abnormalities here. Reg-DEC does not show any localization of pathologies in these examples. The fourth column shows examples of DME that were rightly identified by Reg-DEC, despite not being part of the training data, along with ellipses showing localized regions of disease activity. They were assigned to clusters 4-7, respectively. The CNNs trained to classify AMD and normal would mostly classify the second and third image as diseased, while the first image was usually classified as normal because of its similar appearance to some normal images. Thus, our method identifies different patient cohorts despite those not being part of the training data.

