Macroeconomic performance, social spending, and distribution
Okun's 'big trade-off' refers to the incompatibility of fortuitous macroeconomic performance and extensive welfare states (1975; for a critique, see Blank, 1994). High levels of growth can be achieved, but only if the welfare state is kept at bay. With respect to macroeconomic performance, it is worth comparing GDP, GDP growth, inflation, and public deficit and debt levels across welfare regimes. The GDP of most Scandinavian, Continental, and Anglo-Saxon countries is close to US$30,000 in constant prices and constant PPS whereas the southern European and new Member States on average depict lower levels of GDP (Fig. 7.1). Levels are highest in the Scandinavian and Continental regimes as well as, since the early twenty-first century, in the Anglo-Saxon regime. Ireland has experienced the highest increase in real GDP in the last two decades in Europe, followed by Finland, Sweden, the UK, Greece, and the Netherlands. However, if growth is measured as a percentage of GDP, average growth rates are highest in the new Member States, as well as Ireland, Greece, and Portugal.
Turning to the issue of macroeconomic stability from the mid 1980s, we observe a remarkable convergence in terms of price stability and fiscal consolidation across Western Europe. Levels of inflation, still varying between 1.0

Figure 7.1. GDP per capita (US$, constant prices, constant PPS). Source: OECD.

Figure 7.2. Annual inflation, consumer prices in selected countries. Source: OECD.
and 16.2 per cent in 1990, declined rapidly until the end of the decade (Fig. 7.2). In 1999, no EU-15 member country displayed an inflation rate of more than 2.5 (Ireland). Hereafter inflation increased mildly in those welfare states that adjusted most successfully to the challenges of the 1990s, such as Ireland, Denmark, Portugal, and the Netherlands, reaching levels of 5.1 per cent in the Netherlands in 2001 and 4.4 per cent for Portugal in the same year, due to economic overheating. We can ascertain a similar cross-national convergence with respect to the growth in unit labour costs, which came almost to a complete halt over the 1990s. This contrasts sharply with developments in the 1970s and 1980s decades of stagflation. There has been a convergence towards wage moderation, which has been more or less accepted by the unions in most European countries.
Europe's budget deficit shrank from 4.6 per cent to 2.5 per cent, while that of the United States remained high (at 4 per cent). The Scandinavian countries that experienced a deficit of 2 per cent in 1990 came to enjoy a surplus of 2.3 per cent on average by 2007. The Continental countries were able to reduce their deficit from 5 to 2.5 per cent, but this trend was due to the large reductions in Italy and Belgium, while public deficits increased in Germany and France. The Mediterranean countries managed to reduce their deficit in their successful campaign to enter the EMU. Belgium, France, and Italy considerably reduced their public deficits between 1993 and 2000. The United Kingdom enjoyed surpluses up to 2000, but experienced a new deficit of 3 per cent in 2007. Public budgets, still varying between a surplus of 4.2 per cent in Sweden and a deficit of 11.1 per cent in Italy, were consolidated since the mid 1990s. By 1998 none of the EU Member States displayed a public deficit above 3.3 per cent, and Denmark and Sweden even started to produce budget surpluses again. In the 1990s, broadly speaking, all mature European welfare states have to varying degrees followed a course of macroeconomic stability. However, despite strong economic growth in the second half of the 1990s deficits in Continental and Mediterranean countries could not be turned into surpluses, as has happened in the Scandinavian countries.
Finally, the national debt in a majority of Western European welfare states by 2007 varied between 10 and 80 per cent of GDP, with Italy, Greece, and Belgium exhibiting much higher debt levels of more than 100 per cent (see Fig. 7.3).
After having looked at relative macroeconomic performance, it is interesting to consider social expenditure so as to take a first cut on the prevalence of an inescapable trade-off between economic efficiency and welfare protection. Do high levels of social expenditure hamper economic progress? Western European welfare regimes vary widely in their levels of public social expenditures and total taxation, with the Scandinavian and Continental countries
Table 7.1. General government financial balances, surpluses, or deficits (as % of nominal GDP)
|
Lowest outcome 1992-2007 |
Highest outcome 1992-2007 |
Value in 2007 |
|
|
Scandinavian regime |
|||
|
Denmark |
-3.8 (1993) |
5.0 (2005/6) |
4.5 |
|
Finland |
-8.3 (1993) |
6.9 (2000) |
5.2 |
|
Sweden |
-11.2 (1993) |
3.8 (2007) |
3.8 |
|
Continental regime |
|||
|
Germany |
-9.7 (1995) |
1.3 (2000) |
0.2 |
|
France |
-6.4 (1993) |
-1.5 (2000) |
-2.7 |
|
Netherlands |
-9.2 (1995) |
2.0 (2000) |
0.2 |
|
Belgium |
-8.2 (1992) |
0.4 (2001) |
-0.2 |
|
Austria |
-5.9 (1995) |
-0.2 (2001) |
-0.7 |
|
Anglo-Saxon regime |
|||
|
Ireland |
-2.9 (1992) |
4.8 (2000) |
0.2 |
|
United Kingdom |
-8.0 (1993) |
3.7 (2000) |
-2.7 |
|
Mediterranean regime Italy |
-10.4 (1992) |
-0.9 (2000) |
-1.5 |
|
Greece |
-11.9 (1993) |
-3.1 (1999) |
-4.0 |
|
Portugal |
-7.5 (1993) |
-2.7 (2007) |
-2.7 |
|
Spain |
-7.3 (1993) |
2.0 (2006) |
1.9 |
|
Baltic countries |
|||
|
Lithuania |
-11.4 (1997) |
-0.5 (2005/6) |
-1.2 |
|
Visegrad countries |
|||
|
Czech Republic |
-13.4 (1995) |
-0.7 (2007) |
-0.7 |
|
Hungary |
-12.8 (1994) |
-3.0 (2000) |
-5.0 |
|
Poland |
-6.3 (2003) |
-1.9 (2007) |
-1.9 |
|
Slovakia |
-12.3 (2000) |
-1.9 (2007) |
-1.9 |
Source: OECD, Financial Balances, Economic Outlook 86 database.

Figure 7.3. Total central government debt (as % of GDP). Source: OECD.
ranking high and Anglo-Saxon and southern European countries low (Obin- ger and Wagschal, 2010). The Nordic countries are by far the most generous welfare states in Europe, paid for by high levels of taxation. The Continental countries hold an intermediate position, closely followed by southern Europe, and then by Anglo-Saxon countries, which have the lowest level of taxation.
We should be very careful not to equate social expenditure with welfare state effort (Castles, 2004, 2005; De Deken and Kittel, 2007). A first methodological challenge is that measures of social expenditures as a percentage of GDP do not reflect changes in economic output, policy change, and spending reallocation, and changes in the size of target populations (Clayton and Pontusson, 1998; Korpi and Palme, 2003; Allan and Scruggs, 2004; Scruggs, 2007). Second, as Esping-Andersen has argued long ago, politicians hold preference over specific policy programmes, protecting important groups against specific social risks, and, therefore, not over the level of spending as such (Esping-Andersen, 1990: 19).
With respect to levels of social protection, we again continue to observe tremendous cross-regime variation. Denmark, Finland, and Sweden continue to be the most generous welfare states with very high levels of spending, especially on social services. The Continental welfare states remain at intermediate levels of social spending and clearly spend less on social services than their Nordic counterparts (see also Anttonen and Sipila, 1996). At the lower end of the scale of social protection, we find the liberal Anglo-Saxon and the southern welfare states, which are lean in terms of both social expenditure and public services. Unsurprisingly, gross public social expenditure is highest in Scandinavia, at 34.1 per cent of GDP in Denmark and 32.1 per cent in Sweden.
Ireland, as well as some of the new Member States such as Slovakia and the Czech Republic, has the lowest gross public expenditure. The level of (gross) public social expenditure cannot be interpreted as a uniform measure of welfare state generosity. In Scandinavian countries, for example, benefits are taxed, while in many Anglo-Saxon, Continental, and Mediterranean European welfare states tax exemptions, mortgage interest relief, and subsidies serve as a substitute for (hidden) social expenditure. If we look at net total expenditure and consider private as well as public spending, the band of regime-specific variation becomes narrower: total spending in the Scandinavian and Continental regimes, as well as Italy, are comparably high, also the UK shows quite high spending levels.
Despite changes in the overall economic environment and sequences of policy reforms, portrayed in previous chapters, expenditure levels on social protection expressed as a percentage of GDP have remained relatively stable if not increased over the last two decades as Fig. 7.4 shows for a selection of countries.
Table 7.2. Public and private (both mandatory and voluntary) social spending (% of GDP)
|
1990 |
-4 |
1995 |
-9 |
2000 |
-4 |
2005 |
-7 |
|
|
Public |
Private |
Public |
Private |
Public |
Private |
Public |
Private |
|
|
Scandinavian regime Denmark |
27.0 |
1.7 |
27.4 |
2.0 |
26.8 |
2.6 |
26.6 |
2.8 |
|
Finland |
30.6 |
1.1 |
28.5 |
1.3 |
25.1 |
1.2 |
25.7 |
1.2 |
|
Sweden |
33.4 |
1.6 |
30.8 |
2.2 |
29.2 |
2.4 |
28.3 |
2.8 |
|
Continental regime Belgium |
25.9 |
1.7 |
26.1 |
2.3 |
26.1 |
3.0 |
26.4 |
4.6 |
|
Germany |
24.7 |
3.1 |
26.8 |
3.1 |
27.1 |
3.2 |
26.2 |
3.2 |
|
France |
26.5 |
1.6 |
28.7 |
2.0 |
28.4 |
2.6 |
28.7 |
2.8 |
|
Netherlands |
25.6 |
6.2 |
22.0 |
6.7 |
20.5 |
7.3 |
20.4 |
7.8 |
|
Austria |
25.1 |
1.3 |
26.7 |
1.3 |
27.3 |
2.2 |
26.9 |
2.1 |
|
Anglo-Saxon regime Ireland |
15.9 |
1.5 |
14.3 |
1.6 |
14.9 |
1.5 |
15.9 |
1.5 |
|
United Kingdom Mediterranean regime |
19.1 |
5.6 |
19.1 |
6.3 |
19.5 |
6.5 |
20.5 |
5.9 |
|
Greece |
16.5 |
1.6 |
18.2 |
1.9 |
19.9 |
2.0 |
21.2 |
1.7 |
|
Spain |
21.5 |
0.3 |
20.9 |
0.3 |
20.6 |
0.3 |
21.5 |
0.5 |
|
Italy |
20.6 |
1.4 |
22.2 |
1.4 |
24.0 |
4.2 |
25.0 |
3.1 |
|
Portugal |
14.3 |
1.0 |
17.1 |
1.1 |
20.6 |
1.4 |
22.8 |
1.8 |
|
Visegrad countries* Czech Republic |
17.4 |
18.7 |
0.1 |
20.1 |
0.1 |
19.1 |
0.1 |
|
|
Hungary |
21.3 |
21.3 |
0.0 |
23.0 |
0.1 |
|||
|
Poland |
21.7 |
22.2 |
21.9 |
0.0 |
20.8 |
0.0 |
||
|
Slovakia |
18.4 |
0.4 |
17.3 |
0.8 |
16.0 |
1.1 |
*Before 2002, data on voluntary private spending is incomplete or missing for most Visegrad countries. Source: OECD, Social and Welfare Statistics.

Figure 7.4. Gross versus net social expenditure (% of GDP at factor costs), 2001-7. Source: OECD.
Gross public social spending levels are somewhat problematic. According to Adema and Ladaique (2005, 2009) and Adema and Whiteford (2010) data on gross public spending do not give the full picture of collective social effort across countries, for two reasons. First, data on spending do not take into account the impact of tax systems, and secondly, it misses out on the compulsory private social arrangements. The second problem can be addressed by including mandatory private spending, but the omission of the impact of tax systems still remains problematic. However, gross data on social expenditure that are frequently used tend to overestimate differences across countries as (a) in some countries but not in others benefits are taxed, (b) tax breaks for social purposes can act as a functional equivalent to cash benefits, and (c) private social expenditure, sometimes on a mandatory and publicly subsidized basis, plays a varying role as a partial substitute for direct public expenditure. Estimates of net spending on social purposes including private expenditure are available for some OECD countries. They show greater convergence across families of welfare states. Here, the continental European countries France and Germany are at the top, followed by Sweden, but also, notably, the US and the United Kingdom. Moreover, public spending is always correlated with business cycles and economic development. A higher GDP might give a government more tax revenue and hence more money to spend, such that an increase in spending on a particular policy goal might not signal a different emphasis of the regime. On the other hand, declining unemployment might concur with lower aggregate spending on active labour market policies. It would be wrong to conclude from such spending reduction that the government is refraining from activating the unemployed. It could well be the case that as aggregate spending declines, spending on active labour market policy per client in fact goes up, as there will be fewer unemployed to cater for (see also Alber and Gilbert, 2010).
Moreover, spending is not an objective of the welfare state, but an instrument to foster life chances. If we analyse public spending on social policy in more detail by policy function in 2005, a number of things stand out. First, the Continental welfare states currently spend almost as much on active labour market policy as do the Scandinavian states. There has thus been a considerable catching-up exercise here compared with the 1980s. The other welfare states lag behind on this point. Spending on disability benefits is high in the Netherlands and the Scandinavian welfare states. Spending on family support is highest in Scandinavia, closely followed by the Continental welfare states. However, these apparently similar figures mask a great difference between the two clusters. In the Continental welfare states, mothers are discouraged by child benefit from participating in the labour market, while in the Scandinavian welfare states the emphasis is on active social services in public childcare facilities coupled with generous parental leave arrangements for working parents and double-earners with children (Lambert, 2008). The differences in spending on healthcare are fairly minimal, though when it comes to care for the elderly it is notable that the Continental and Mediterranean welfare states, with the exception of the Netherlands and Spain, spend a great deal on pensions.
As is visible in Fig. 7.5, on public social expenditure and GDP per capita in 2007, in general countries with a higher GDP per capita spent more on social protection, with the exception of the Anglo-Saxon countries and the Netherlands which depict low levels of social spending. Considering the level of GDP, Scandinavian countries spend the most, followed by Continental countries except for the Netherlands. The Mediterranean regime countries exhibit intermediate spending levels while the new Member States and the Anglo- Saxon countries have the lowest public social expenditure in relation to their GDP. By juxtaposing public deficits and public social spending we arrive at a paradoxical finding that countries with high deficits on average spent less on welfare while countries with surpluses tended to spend more (Fig. 7.6). This underlines that high spending does not necessarily result in higher debts if accompanied by higher revenues, which suggest highly effective tax administrations.
|
Total social expenditure |
Old age |
Survivors |
Incapacity related |
Health |
Family |
Active labour market programmes |
Unemployment |
Housing |
Other social policy areas |
|
|
Scandinavian regime Denmark |
27.3 |
7.3 |
0.0 |
4.3 |
5.9 |
3.4 |
1.7 |
2.8 |
0.7 |
1.0 |
|
Finland |
26.1 |
8.5 |
0.9 |
3.8 |
6.2 |
3.0 |
0.9 |
2.0 |
0.3 |
0.5 |
|
Sweden |
29.8 |
9.6 |
0.6 |
5.6 |
6.8 |
3.2 |
1.3 |
1.2 |
0.5 |
0.6 |
|
Norway |
22.9 |
6.3 |
0.3 |
4.4 |
5.8 |
2.8 |
0.7 |
0.5 |
0.1 |
0.6 |
|
Continental regime Germany |
27.9 |
11.2 |
0.4 |
1.9 |
7.7 |
2.2 |
1.0 |
1.7 |
0.6 |
0.2 |
|
France |
29.5 |
10.9 |
1.8 |
1.9 |
7.8 |
3.0 |
0.9 |
1.7 |
0.8 |
0.4 |
|
Netherlands |
21.6 |
5.5 |
0.3 |
3.6 |
6.0 |
1.6 |
1.3 |
1.5 |
0.3 |
0.6 |
|
Belgium |
26.4 |
7.2 |
2.0 |
2.3 |
7.3 |
2.6 |
1.1 |
3.3 |
0.1 |
0.4 |
|
Austria |
28.1 |
12.6 |
0.4 |
2.4 |
6.8 |
2.8 |
0.6 |
1.1 |
0.1 |
0.3 |
|
Anglo-Saxon regime Ireland |
16.7 |
2.9 |
0.8 |
1.6 |
6.5 |
2.5 |
0.6 |
0.9 |
0.5 |
0.3 |
|
Unitekd Kingdom |
22.1 |
6.1 |
0.2 |
2.4 |
7.0 |
3.2 |
0.5 |
0.3 |
1.4 |
0.2 |
|
Mediterranean regime Italy |
26.5 |
11.6 |
2.5 |
1.7 |
6.8 |
1.3 |
0.6 |
0.5 |
0.0 |
0.0 |
|
Greece |
20.5 |
10.8 |
0.8 |
0.9 |
5.6 |
1.1 |
0.1 |
0.4 |
0.5 |
0.4 |
|
Portugal Spain |
No data available 21.2 |
7.9 |
0.6 |
2.5 |
5.8 |
1.1 |
0.8 |
2.2 |
0.2 |
0.2 |
|
Visegrad countries Czech Republic |
19.7 |
7.5 |
0.2 |
2.4 |
6.3 |
1.7 |
0.3 |
0.6 |
0.1 |
0.4 |
|
Hungary |
22.5 |
8.8 |
0.3 |
2.8 |
6.0 |
3.1 |
0.3 |
0.6 |
0.5 |
0.1 |
|
Poland |
21.0 |
10.4 |
1.0 |
2.7 |
4.3 |
1.1 |
0.4 |
0.5 |
0.1 |
0.4 |
|
Slovakia |
16.8 |
6.2 |
0.2 |
1.7 |
5.3 |
2.1 |
0.3 |
0.3 |
0.0 |
0.5 |
Source: OECD, Social and Welfare Statistics.

Figure 7.5. Public social expenditure and GDP per capita, 2007. Source: OECD.
When we shift the attention of analysis away from macroeconomic performance and spending to distributive performance, social policy effectiveness varies considerably across welfare regimes. The Anglo-Saxon countries display not only high levels of wage dispersion, but also comparatively high poverty rates and a comparatively inegalitarian distribution of disposable household income in comparison to Scandinavian or Continental welfare

Figure 7.6. Public social expenditure (as % of GDP). Source: OECD.
states (Moller et al., 2003). The outlier here is Ireland, which displays medium levels in distributive outcomes alongside extremely high levels of economic growth. The Continental welfare states are by and large located in the middle range, displaying a medium performance in terms of distribution. However, within the sample of Continental welfare states, the spectrum is wide. The southern welfare states, with average levels of wage dispersion, reveal strong disparities in terms of post-tax and transfer income distribution and poverty.
This could be interpreted as a result of their focus on pensions and the traditional male-breadwinner model, consequently lacking an adequate safety net for youth, single mothers, and the long-term unemployed. The exception here again is Portugal. Belgium and the Netherlands, although belonging to the Continental cluster, reveal a distributive performance along all three dimensions comparable to the Nordic welfare states. Earnings inequality can be assessed with different measures, for instance by comparing the ratios of income quintiles or deciles to each other so as to see how equal the distribution of income is, or by using the Gini coefficient. A score of 0 on the Gini index means that income is equally distributed among the population, 100 is the most unequal score (Fig. 7.7). Concerning the European welfare states, there does not seem to be one common pattern in the distribution of income. The Anglo-Saxon countries and the Mediterranean countries have much more unequal income distributions than the Continental and Scandinavian countries. The best performers in 1997, the Scandinavian countries, experienced a slight increase in inequality since, while the Continental countries seemed to have decreased incomes inequality somewhat up to the mid 2000s.
Another measure of redistribution, the at risk of poverty rate, defines poverty as the percentage of the population that is below 60 per cent of the median wage.2 Again, there seems to be a split between the Mediterranean and Anglo-Saxon countries, with at risk of poverty rates of around 20 per cent, and the Scandinavian and Continental countries with rates of between 10 per cent and 15 per cent over the largest part of the period. Between 1997 and 2007, the risk of poverty increased in the Scandinavian and Continental countries and stagnated in the southern European Member States. Furthermore, at risk of

Figure 7.7. Gini coefficient, 1997 and 2007. Source: Eurostat.

Figure 7.8. Risk of poverty for children under 16. Source: Eurostat.
poverty rates differ per age group and household composition. For children under 16, risk of poverty used to be highest in the Anglo-Saxon countries but decreased between 1997 and 2007 to levels comparable to the Mediterranean countries (Fig. 7.8). In the Continental countries risk of poverty for children under 16 fluctuates around 15 per cent while it increased in the Scandinavian countries from around 5 per cent in 1997 to 10 per cent in 2007. In the new Member States poverty varies between 15 per cent and 24 per cent.
Risk of poverty is even more pronounced for singles with dependent children (Fig. 7.9). Although these poverty rates declined in the Anglo-Saxon countries between 1997 and 2007, they are still exhibiting the highest at risk of poverty rates for singles with dependent children in this sample of around 40 per cent. The southern European and Continental countries mostly range around 30 per cent. Germany, Portugal, and the Netherlands achieved a more than 10 per cent decrease within one decade, while poverty rose in the other countries of these two regime types. Scandinavian countries show risk of poverty rates of approximately 20 per cent for singles with dependent children, with Finland facing a more than 10 per cent increase within ten years. The new Member States show varying rates of between 25 and 40 per cent.
At risk of poverty figures for the elderly aged above 65 reveal high variations across Europe and diverse trends (Fig. 7.10). In 1997 poverty rates were especially pronounced in Portugal (37 per cent) and Greece (34 per cent) and approached the level of other southern European countries of around 25 per cent in 2007. The Anglo-Saxon countries depict an increase from around
Figure 7.10. Risk of poverty for persons over 64. Source: Eurostat.

Figure 7.9. Risk of poverty for single parents with dependent children, 1997 and 2007. Source: Eurostat.

25 per cent to 28 per cent while the Continental and Scandinavian countries vary markedly between 4 per cent (the Netherlands in 1997) and 23 per cent (Belgium in 2007). The risk of poverty for elderly aged 65 and above is the lowest in the Netherlands (9.5 per cent in 2007) and Sweden (9.9 per cent in 2007).
How much of this variation in poverty is due to differences between the welfare states can be better assessed when accounting for the poverty-reducing effects of taxes and transfers by using a poverty line of 50 per cent of household disposable income. As is visible from Fig. 7.11, while Denmark, Sweden, France, and Czech Republic achieved the highest percentage point reduction in the poverty rate, Portugal and Ireland realized lower levels of poverty reduction. Much variation exists also within regimes, but the figures also point to the fact that higher pre-transfer poverty in some countries than in others might explain variation in poverty rates between countries such as Finland and Italy. Whose poverty is reduced also varies across Europe. Most countries depict high poverty reductions for the retired population especially in the Netherlands and much lower for those of working age and children. Outliers here are Finland, and France and Portugal for the retired population. Furthermore, in many countries the poverty reducing effect of taxes and transfers decreased between the mid 1990s and mid 2000s, especially for children. Only in Italy and the UK did it increase for children, the working- age, and the retirement-age populations. Concerning the regime types, for the Scandinavian countries it is apparent that for all population groups the poverty-reducing effects of taxes and transfers are comparably high. The Mediterranean countries depict the lowest poverty reduction for children in comparison to the other countries. The Continental countries exhibit high levels of within-regime variation. The Anglo-Saxon countries range somewhere in the middle, and the Czech Republic, the only new EU Member State in the graph, shows a bias towards higher poverty reduction for the elderly and overall quite high levels of poverty reduction in general.
The inter-quintile share ratio divides the disposable income of the fifth quintile by that of the first quintile, thus the bigger the outcome the more unequal is the distribution of incomes.
The reduction in inequality by public services displayed in Fig. 7.12 shows that it is highest in the Mediterranean and Anglo-Saxon countries. However, these countries also face the highest inequality in disposable income before inclusion of public services.
As OECD figures based on the 2011 report 'Doing Better for Families' show, countries investing more per child aged 0 to 17 reveal lower child income poverty rates (Fig. 7.13). Here again, Continental and Scandinavian countries spend most and show lower child poverty rates.
Concerning the poverty decreasing effect of transfers, Table 7.4 gives evidence that Scandinavian countries, particularly, are able to reduce child

Figure 7.11. Effects of taxes and transfers in reducing poverty ((1) among the entire population, (2) among children, adults, and the elderly).
Source: OECD.
poverty considerably via maintenance payments and child support. For Continental and Mediterranean countries, this is true only for child poverty in single-parent families, while this is much less the case for new Member States, and not at all for Anglo-Saxon countries. However, Poland exhibits an enormous decrease in child income poverty in single-parent families due to maintenance payments and child support.
As Fig. 7.14 shows, poverty persistence throughout Europe is especially pronounced in countries with high poverty rates such as Ireland, Greece, and Portugal, while it is much lower in Scandinavian and most Continental

Figure 7.12. Inter-quintile share ratio before and after inclusion of all types of public services to households, 2000.
Source: OECD, Secretariat calculations based on ECHP.

Figure 7.13. Child income poverty and spending on childcare, education, benefits, and transfers.
Source: OECD, Doing Better for Families (2011a).
Table 7.4. Child poverty rates (50% of median household equivalized income) and influence of child-support payments (%)
|
Child poverty before consideration of the child- support system |
Child poverty after advances on maintenance payments and receipt of child support and payment of child support |
Child poverty in singleparent families before consideration of the child- support system |
Child poverty in single-parent families after advances on maintenance payments and receipt of child support AND payment of child support |
|
|
Denmark (2004) |
6.4 |
3.9 |
23.3 |
8.5 |
|
Finland (2004) |
5.4 |
3.7 |
22.8 |
11.2 |
|
Sweden (2005) |
7.4 |
4.7 |
21.2 |
9.7 |
|
Belgium (2000) |
8.3 |
7.2 |
36.0 |
25.9 |
|
Germany (2004) |
13.3 |
10.7 |
49.8 |
38.1 |
|
France (2000) |
8.7 |
7.9 |
34.2 |
28.0 |
|
Austria (2004) |
8.7 |
7.0 |
32.7 |
19.6 |
|
Netherlands (2004) |
10.4 |
9.1 |
28.1 |
20.5 |
|
Ireland (2004) |
17.0 |
15.8 |
41.9 |
38.7 |
|
United Kingdom (2004) |
14.8 |
14.0 |
35.6 |
32.5 |
|
Greece (2004) |
14.8 |
13.2 |
43.4 |
35.5 |
|
Italy (2004) |
18.5 |
18.4 |
29.0 |
26.7 |
|
Spain (2004) |
17.7 |
17.2 |
39.4 |
33.2 |
|
Hungary (2005)a |
10.3 |
9.9 |
25.9 |
25.9 |
|
Poland (2004) |
19.6 |
17.2 |
40.4 |
22.5 |
Note: Families are defined as households with at least one child under 18. a Denotes when a weighted country sample is below 200 cases.
Source: OECD, 2011.
countries. For intergenerational mobility, it is apparent that most Scandinavian countries face low income inequality and low intergenerational earnings elasticity meaning that social mobility is high, while Great Britain shows a diametrically adverse relationship. For Spain, however, income inequality is high but intergenerational earnings elasticity comes in the middle at 0.3, thereby indicating that the relation between the parents' and children's income is lower than in Anglo-Saxon countries.
Based on the available evidence from the OECD and Eurostat we can safely conclude that there is not necessarily a trade-off between macroeconomic efficiency and welfare policy equity. Less generous welfare states are not associated with weak economic performance. If anything, there is some indication of a reverse relationship. The striking improvement in the economic performance of the Scandinavian Member States in the second half of the 1990s contradicts the hypothesis that a generous welfare state by definition has a negative effect on GDP growth. The Dutch macroeconomic performance in the 1990s also refutes the hypothesis of a trade-off between social justice
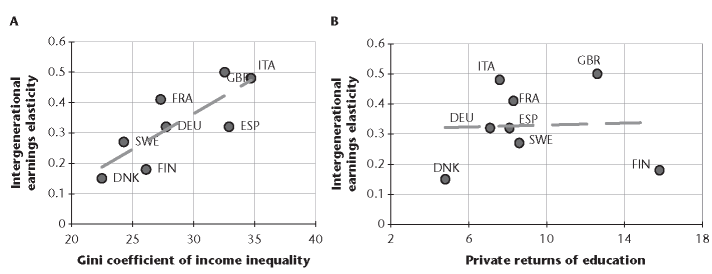
Figure 7.14. Poverty persistence and intergenerational mobility.
Note: Intergenerational mobility is measured by the earnings elasticity between fathers and sons. Income inequality is measured by the Gini coefficient of equivalized household disposable income. The private internal rate of return on education is estimated on the basis of the addition of after-tax earnings that results from a higher level of educational attainment, net of the additional private costs (tuition and forgone earnings) that attaining this higher level of education requires; the estimates shown refer to an individual who has invested in tertiary education after having completed upper secondary education.
Source: Data on intergenerational earnings elasticity are based on the meta-analysis carried out by Corak (2006) for most countries. Those for Spain, Australia and Italy are from D'Addio (2006). Data on private returns of education are from OECD, Education at a Glance, various years (table A.9.6 in
Source: OECD, Growing Unequal (2008: 296).
and economic efficiency. On the contrary, there is some indication that the opposite causality may be stronger. Over the last decade the Scandinavian countries have achieved higher overall levels of GDP than many economies on the European continent, or comparable to Anglo-Saxon countries, while attaining budgetary surpluses. High welfare spending does not per se come at the cost of high public deficits and debts.
There is some evidence that inequality has increased in EU Member States, although the trends have been far from stable. In terms of redistributive performance, we have been able to observe that poverty and inequality is lowest in Scandinavia and highest in the Mediterranean countries, followed by the Anglo-Saxon countries and some of the new Member States. Likewise, intergenerational transmission and persistence of poverty is highest in the Mediterranean countries and lowest in Scandinavia and the Netherlands. While some countries do not manage to overcome the trade-off between equality and efficiency, the Scandinavian countries, followed by the Continental welfare states, achieve high levels of growth, manage to keep positive public balances, and still reach low levels of income inequality.

