Relative Brain Size
Studies of artificial selection for brain size suggest two conclusions. First, brain size is correlated to body size, a relationship that could be explained by a common set of genes controlling the growth of these two characters (e.g., growth hormones). The positive correlation between brain size and body size is described by the allometric equation (Box 5.2). Second, the size of the brain can increase beyond the size expected on the basis of body size. This active increase in brain size, called encephalization, is discussed in the next section.
Box 5.2 The Allometric Equation and the Encephalization Quotient
The allometric equation relates changes in the size of one organ, body part, or function, to changes in body size according to a power function:
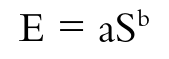
where E is brain size or weight (from the French “poids encephalique”), S is body size or weight (“poids somatique”), and a and b are empirical constants for the point of origin and slope, respectively, of the function relating brain and body size. Allometric functions are usually represented in double logarithmic coordinates because this yields a straight line:

The allometric equation described allometric growth and can be used to generate an index of encephalization called the encephalization quotient (EQ). Usually, the EQ weighs the E of a particular species against the allometric equation with the parameters appropriate for the class to which that species belongs, according to the following equation:

Therefore, if the brain size of a particular species falls on top of the regression line, then the obtained and expected brain sizes are equal and EQ = 1. An EQ > 1 implies that the brain is larger than expected for that class (encephalization), whereas an EQ < 1 implies a smaller brain than expected for that class (decephalization). The outcome of this equation depends on the values assigned to the constants in the allometric equation. EQs are extensively used as a life-history trait. Table 5.5 presents a list of EQs for various mammals that provides a general idea of the variation within taxa (from Eisenberg, 1981; with a = 0.05 and b = 0.74).
It makes sense for brain and body size to be positively correlated. The brain contains cells that process afferent information from the body (sensory receptors) and control muscles and organs. Thus, the larger the body of an animal, the greater the number of neurons needed to perform these functions. An elephant’s brain should be larger than a mouse’s brain simply because the elephant is larger. Two questions need answers.
First, what is the relationship between the size of neurons and the size of the brain across species? To determine the number of neurons and nonneural cells, brains can be processed with a method that preserves cell nuclei. Then, nuclei are sampled, stained with a fluorescent marker, and counted. This provides an estimate of the total number of cells. An antigen expressed in neurons, but not in nonneuronal cells, allows for a differential count of cell components. Applying this procedure to the brains of rodents, from the small mouse to the large capybara, suggested that the size of neurons increased with the brain, whereas the size of nonneural cells remained constant (Herculano-Houzel, Mota, & Lent, 2006). The implication is that the density of neurons decreases as brain size increases across species. Unlike in rodents, the size of neurons in primates (Herculano-Houzel, Collins, Wong, & Kaas, 2006) and birds (Olkowicz et al., 2016) remains constant with changes in brain size. In corvids and parrots, neuronal density in the telencephalon is even higher than in primates. Therefore, the brains of primates and birds contain more neurons than the brains of rodents of similar brain size.
Second, what is the relationship between the size of the brain and the size of the body across species? One way to answer this question is to plot brain and body size for a large sample of species (Jerison, 1973). When information on brain and body size from a sample of vertebrates is plotted in double logarithmic scales, the resulting functions are linear and fit by the allometric equation. To simplify, the outer points in the sample are connected to form a polygon that includes all the data for a given class of vertebrates. Figure 5.18 shows these polygons for each vertebrate class and only for living species. Each species provides at least one point for this graph, representing the size of its brain and body.

Figure 5.18 Relative brain size of various vertebrate classes. Samples include living species only. Each polygon encloses all the data points for individual species within each class. Extensive overlap exists between birds and mammals on the one hand, and between teleost fish, amphibians, and reptiles on the other, but these two sets are segregated. The exceptions are a few species ot teleost fish and the cartilaginous fish (sharks and rays) which overlap with the polygon tor mammals and birds.
Source: Northcutt (2002); reproduced with permission from Integrative and Comparative Biology.
Jerison (1973) noted that the slopes of these polygons (parameter b in the allometric equation; Box 5.2) tend to be relatively similar and fall around a value of 0.67. When b = 1, then for every unit of increase in body size, there is a unit of increase in brain size; this is called isometric growth. But when b = 0.67, it implies that increases in brain size across species do not catch up with increases in body size. This is called negative allometry (then, b > 1 is called positive allometry). Since the surface of a solid grows with a 2/3 exponent of its volume, Jerison (1973) suggested that the increase in brain volume was dependent on increases in the body surface, rather than body volume. But this view was later revised as new data came to light.
Table 5.4 summarizes the slope values for various classes of vertebrates. Notice that all exponents show negative allometry. Moreover, there is variability in these exponents, especially when orders within these vertebrate classes are analyzed separately. For example, among the cartilaginous fish, skates and rays show high slopes (b = 1.04 and even b = 1.38; Northcutt, 1977). By contrast, the slope for anuran amphibians (frogs and toads) is relatively low: b = 0.47 (Platel, 1979). Jerison (1973) had obtained a 0.67 value constant for all of his analyses, which suggested that the same factors determined the evolution of relative brain size in vertebrates. Diverging slopes suggest that the evolution of relative brain size was driven by different forces in the various vertebrate groups.

