Trading Up, Down, and Over
Michael Silverstein and Neil Fiske, the authors of Trading Up, have observed a number of middle-market consumers periodically “trading up” to what they call “New Luxury” products and services “that possess higher levels of quality, taste, and aspiration than other goods in the category but are not so expensive as to be out of reach.” Three main types of New Luxury products are:
- • Accessible super-premium products (such as Kettle gourmet potato chips), which carry a significant price premium but are still relatively low-ticket items in affordable categories.
- • Old Luxury brand extensions (such as the Mercedes-Benz C-class), which retain their cachet while extending historically high- priced brands down-market.
- • Masstige goods, such as Kiehl’s skin care products, which are “based on emotions” and are priced between average middle-market brands and super-premium Old Luxury brands.
To trade up to brands that offer these emotional benefits, consumers often “trade down” by shopping at discounters for staple items or goods that deliver quality and functionality. The recent economic downturn increased the prevalence of trading down. As the economy improved and consumers tired of putting off discretionary purchases, retail sales picked up. Trading up and down has persisted, however, along with “trading over” or switching spending from one category to another, buying a new home theater system, say, instead of a new car.
Sources: Cotten Timberlake, "U.S. 2 Percenters Trade Down with PostRecession Angst,” www.bloomberg.com, May 15, 2013; Anna-Louise Jackson and Anthony Feld, “Frugality Fatigue Spurs Americans to Trade Up,” www.bloomberg.com, April 13, 2012; Walker Smith, “Consumer Behavior: From Trading Up to Trading Off,” Branding Strategy Insider, January 26, 2012; Bruce Horovitz, “Sale, Sale, Sale: Today Everyone Wants a Deal,” USA Today, April 21, 2010, pp. 1A-2A; Michael J. Silverstein, Treasure Hunt: Inside the Mind of the New Consumer (New York: Portfolio, 2006); Michael J. Silverstein and Neil Fiske, Trading Up: The New American Luxury (New York: Portfolio, 2003).
TABLE 11.1 Steps in Setting a Pricing Policy
|
1. Selecting the Pricing Objective |
|
2. Determining Demand |
|
3. Estimating Costs |
|
4. Analyzing Competitors’ Costs, Prices, and Offers |
|
5. Selecting a Pricing Method |
|
6. Selecting the Final Price |
associated with alternative prices and chooses the price that produces maximum current profit, cash flow, or rate of return on investment. However, the company may sacrifice long- run performance by ignoring the effects of other marketing variables, competitors’ reactions, and legal restraints on price.
Some companies want to maximize their market share, believing a higher sales volume will lead to lower unit costs and higher long-run profit. With market-penetration pricing, firms set the lowest price, assuming the market is price sensitive. This strategy is appropriate when (1) the market is highly price sensitive and a low price stimulates market growth; (2) production and distribution costs fall with accumulated production experience; and (3) a low price discourages actual and potential competition.
Companies unveiling a new technology favor setting high prices to maximize market skimming. Market-skimming pricing, in which prices start high and slowly drop over time, makes sense when (1) a sufficient number of buyers have a high current demand; (2) the unit costs of producing a small volume are not so high that they cancel the advantage of charging what the traffic will bear; (3) the high initial price does not attract more competitors to the market; and (4) the high price communicates the image of a superior product.
A company might aim to be the product-quality leader in the market.14 Many brands strive to be “affordable luxuries”—products or services characterized by high levels of perceived quality, taste, and status with a price just high enough not to be out of consumers’ reach.
Nonprofit and public organizations may have other pricing objectives. A university aims for partial cost recovery, knowing that it must rely on private gifts and public grants to cover its remaining costs. A nonprofit hospital may aim for full cost recovery in its pricing. A nonprofit theater company may price its productions to fill the maximum number of seats.
Step 2: Determining Demand
Each price will lead to a different level of demand and have a different impact on a company’s marketing objectives. The normally inverse relationship between price and demand is captured in a demand curve. The higher the price, the lower the demand. For prestige goods, the demand curve sometimes slopes upward. Some consumers take the higher price to signify a better product. However, if the price is too high, demand may fall.
Price Sensitivity The demand curve shows the market’s probable purchase quantity at alternative prices, summing the reactions of many individuals with different price sensitivities. The first step in estimating demand is to understand what affects price sensitivity. Generally speaking, customers are less price sensitive to low-cost items or items they buy infrequently. They are also less price sensitive when (1) there are few or no substitutes or competitors; (2) they do not readily notice the higher price; (3) they are slow to change their buying habits; (4) they think the higher prices are justified; and (5) price is only a small part of the total cost of obtaining, operating, and servicing the product over its lifetime.
A seller can successfully charge a higher price than competitors if it can convince customers that it offers the lowest total cost of ownership (TCO). Marketers often treat the service elements in a product offering as sales incentives rather than as value-enhancing augmentations for which they can charge. In fact, pricing expert Tom Nagle believes the most common mistake manufacturers make is to offer services to differentiate their products without charging for them.15
Estimating Demand Curves Most companies attempt to measure their demand curves using several different methods. They may use surveys to explore how many units consumers would buy at different proposed prices. Although consumers might understate their purchase intentions at higher prices to discourage the company from pricing high, they also tend to exaggerate their willingness to pay for new products or services.16 Price experiments can vary the prices of different products in a store or of the same product in similar territories to see how the change affects sales. Also, statistical analyses of past prices, quantities sold, and other factors can reveal their relationships.
In measuring the price-demand relationship, the market researcher must control for various factors that will influence demand.17 The competitor’s response will make a difference. Also, if the company changes other aspects of the marketing program besides price, the effect of the price change itself will be hard to isolate.
Price Elasticity of Demand Marketers need to know how responsive, or elastic, demand is to a change in price. If demand hardly changes with a small change in price, we say it is inelastic. If demand changes considerably, it is elastic. The higher the elasticity, the greater the volume growth resulting from a 1 percent price reduction. If demand is elastic, sellers will consider lowering the price to produce more total revenue. This makes sense as long as the costs of producing and selling more units do not increase disproportionately.
Price elasticity depends on the magnitude and direction of the contemplated price change. It may be negligible with a small price change and substantial with a large price change. It may differ for a price cut versus a price increase, and there may be a band within which price changes have little or no effect. Long-run price elasticity may differ from short-run elasticity. Buyers may continue to buy from a current supplier after a price increase but eventually switch suppliers. The distinction between short-run and long-run elasticity means that sellers will not know the total effect of a price change until time passes.
Consumers tend to be more sensitive to prices during tough economic times, but that is not true across all categories.18 One comprehensive review of a 40-year period of academic research on price elasticity yielded interesting findings.19 Price elasticity magnitudes were higher for durable goods than for other goods and higher for products in the introduction/growth stages of the product life cycle than in the mature/decline stages. Also, promotional price elasticities were higher than actual price elasticities in the short run (though the reverse was true in the long run).
Step 3: Estimating Costs
Whereas demand sets a ceiling on the price the company can charge for its product, costs set the floor. The company wants to charge a price that covers its cost of producing, distributing, and selling the product, including a fair return for its effort and risk. Yet when companies price products to cover their full costs, profitability isn’t always the net result.
Types of Costs and Levels of Production A company’s costs take two forms, fixed and variable. Fixed costs, also known as overhead, are costs such as rent and salaries that do not vary with production level or sales revenue. Variable costs vary directly with the level of production. For example, each calculator produced by Texas Instruments incurs the cost of plastic, microprocessor chips, and packaging. These costs tend to be constant per unit produced, but they’re called variable because their total varies with the number of units produced.
Total costs consist of the sum of the fixed and variable costs for any given level of production. Average cost is the cost per unit at that level of production; it equals total costs divided by production. Management wants to charge a price that will at least cover the total production costs at a given level of production.
To price intelligently, management needs to know how its costs vary with different levels of production. The cost per unit is high if few units are produced per day. As production increases, the average cost falls because the fixed costs are spread over more units. Short-run average cost increases after a certain point, however, because the plant becomes inefficient (due to problems such as machines breaking down). By calculating costs for plants of different sizes, a firm can identify the optimal size and production level. To estimate the real profitability of selling to different types of retailers or customers, the manufacturer needs to use activity-based cost (ABC) accounting instead of standard cost accounting.
Accumulated Production Suppose Samsung runs a plant that produces 3,000 tablet computers per day. As the company gains experience producing tablets, its methods improve. Workers learn shortcuts, materials flow more smoothly, and procurement costs fall. The result, as Figure 11.1 shows, is that average cost falls with accumulated production experience. Thus the average cost of producing the first 100,000 tablets is $100 per tablet. When the company has produced the first 200,000 tablets, the average cost has fallen to $90. After its accumulated production experience doubles again to 400,000, the average cost is $80. This decline in the average cost with accumulated production experience is called the experience curve or learning curve.
Now suppose three firms compete in this particular tablet market, Samsung, A, and B. Samsung is the lowest-cost producer at $80, having produced 400,000 units in the past. If all three firms sell the tablet for $100, Samsung makes $20 profit per unit, A makes $10 per unit, and B breaks even. The smart move for Samsung would be to lower its price to $90. This will drive B out of the market, and even A may consider leaving. Samsung will pick up the business that
FiGURE 11.1 Cost per Unit as a Function of Accumulated Production: The Experience Curve
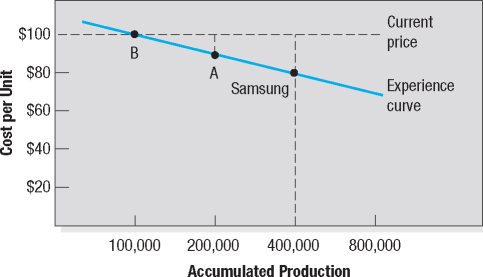
would have gone to B (and possibly A). Furthermore, price-sensitive customers will enter the market at the lower price. As production increases beyond 400,000 units, Samsung’s costs will drop still further and faster, more than restoring its profits, even at a price of $90.
Experience-curve pricing nevertheless carries major risks. Aggressive pricing might give the product a cheap image. It also assumes competitors are weak followers. The strategy leads the company to build more plants to meet demand, but a competitor may choose to innovate with a lower-cost technology. The market leader is now stuck with the old technology.
Target Costing Costs change with production scale and experience. They can also change as a result of a concentrated effort by designers, engineers, and purchasing agents to reduce them through target costing. Market research establishes a new product’s desired functions and the price at which it will sell, given its appeal and competitors’ prices. This price less desired profit margin leaves the target cost the marketer must achieve. The firm must examine each cost element—design, engineering, manufacturing, sales—and bring down costs so the final cost projections are in the target range. Cost cutting cannot go so deep as to compromise the brand promise and value delivered.
Step 4: Analyzing Competitors’ Costs, Prices, and Offers
Within the range of possible prices identified by market demand and company costs, the firm must take competitors’ costs, prices, and possible reactions into account. If the firm’s offer contains features not offered by the nearest competitor, it should evaluate their worth to the customer and add that value to the competitor’s price. If the competitor’s offer contains some features not offered by the firm, the firm should subtract their value from its own price. Now the firm can decide whether it can charge more, the same, or less than the competitor.20
Step 5: Selecting a Pricing Method
The company is now ready to select a price. Figure 11.2 summarizes the three major considerations in price setting: Costs set a floor to the price. Competitors’ prices and the price of substitutes provide an orienting point. Customers’ assessment of unique features establishes the price ceiling. We will examine seven price-setting methods: markup pricing, target-return pricing, perceived-value pricing, value pricing, EDLP, going-rate pricing, and auction-type pricing.
Markup Pricing The most elementary pricing method is to add a standard markup to the product’s cost. Construction companies submit job bids by estimating the total project cost and adding a standard markup for profit. Suppose a toaster manufacturer has the following costs and sales expectations:
Variable cost per unit $10
Fixed costs $300,000
Expected unit sales 50,000
The manufacturer’s unit cost is given by:

If the manufacturer wants to earn a 20 percent markup on sales, its markup price is given by:

FiGURE 11.2 The Three Cs Model for Price Setting

The manufacturer will charge dealers $20 per toaster and make a profit of $4 per unit. If dealers want to earn 50 percent on their selling price, they will mark up the toaster 100 percent to $40.
Generally, the use of standard markups does not make logical sense. Any pricing method that ignores current demand, perceived value, and competition is not likely to lead to the optimal price. Markup pricing works only if the marked-up price actually brings in the expected level of sales. Still, markup pricing remains popular because sellers can determine costs much more easily than they can estimate demand. By tying the price to cost, sellers simplify the pricing task. Also, when all firms in the industry use this pricing method, prices tend to be similar and price competition is minimized. Finally, many people feel cost-plus pricing is fairer to both buyers and sellers.
Target-Return Pricing In target-return pricing, the firm determines the price that yields its target rate of return on investment. Public utilities, which need to make a fair return on investment, often use this method. Suppose the toaster manufacturer has invested $1 million in the business and wants to set a price to earn a 20 percent ROI, specifically $200,000. The target- return price is given by the following formula:

The manufacturer will realize this 20 percent ROI provided its costs and estimated sales turn out to be accurate. But what if sales don’t reach 50,000 units? The manufacturer can prepare a break-even chart to learn what would happen at other sales levels (see Figure 11.3). Fixed costs are stable, regardless of sales volume. Variable costs, not shown in the figure, rise with volume. Total costs equal the sum of fixed and variable costs. The total revenue curve starts at zero and rises with each unit sold.
The total revenue and total cost curves cross at 30,000 units. This is the break-even volume. We can verify it by the following formula:

If the manufacturer sells 50,000 units at $20, it earns $200,000 on its $1 million investment, but much depends on price elasticity and competitors’ prices. Unfortunately, target-return pricing tends to ignore these considerations. The manufacturer needs to consider different prices and estimate their probable impacts on sales volume and profits. It should also search for ways to lower its fixed or variable costs because lower costs will decrease its required break-even volume.
Perceived-Value Pricing An increasing number of companies now base their price on the customer’s perceived value. Perceived value is made up of a host of inputs, such as the buyer’s
FiGURE 11.3 Break-Even Chart for Determining Target-Return Price and Break-Even Volume
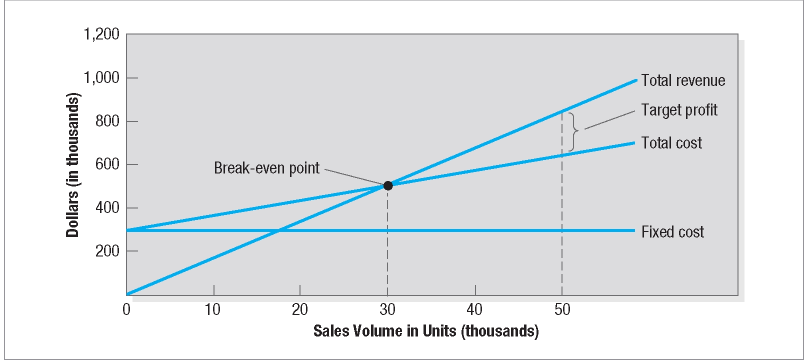
image of product performance, channel deliverables, warranty quality, customer support, and the supplier’s reputation. Companies must deliver the value promised by their value proposition, and the customer must perceive this value. Firms use other marketing program elements, such as advertising, the sales force, and the Internet, to communicate and enhance perceived value in buyers’ minds.
Even when a company claims its offering delivers more total value, not all customers will respond positively. Some care only about price. But there is also typically a segment that cares about quality. The key to perceived-value pricing is to deliver more unique value than competitors and to demonstrate this to prospective buyers.
Value Pricing Companies that adopt value pricing win loyal customers by charging a fairly low price for a high-quality offering. This requires reengineering the company’s operations to become a low-cost producer without sacrificing quality to attract a large number of valueconscious customers.
EDLP A retailer using everyday low pricing (EDLP) charges a constant low price with little or no price promotion or special sales. Constant prices eliminate week-to-week price uncertainty and the high-low pricing of promotion-oriented competitors. In high-low pricing, the retailer charges higher prices on an everyday basis but runs frequent promotions with prices temporarily lower than the EDLP level.21 The most important reason retailers adopt EDLP is that constant sales and promotions are costly and have eroded consumer confidence in everyday prices. Some consumers also have less time and patience for clipping coupons. Yet promotions and sales do create excitement and draw shoppers, so EDLP does not guarantee success and is not for everyone.22
Going-Rate Pricing In going-rate pricing, the firm bases its price largely on competitors’ prices. Smaller firms “follow the leader," changing their prices when the market leader’s prices change. Some may charge a small premium or discount, but they preserve the difference. Going-rate pricing is quite popular. Where costs are difficult to measure or competitive response is uncertain, firms feel it is a good solution because they believe it reflects the industry’s collective wisdom.
Auction-Type Pricing Auction-type pricing is growing more popular, especially with electronic marketplaces. English auctions, with ascending bids, have one seller and many buyers; bidders raise their offers until the highest bidder gets the item. There are two types of Dutch auctions, which feature descending bids. In the first, an auctioneer announces a high price and then slowly decreases the price until a bidder accepts. In the other, the buyer announces something he or she wants to buy, and potential sellers compete to offer the lowest price. In sealed-bid auctions, would- be suppliers submit only one bid; they cannot know the other bids. The U.S. government often uses this method to procure supplies. A supplier will not bid below its cost but cannot bid too high for fear of losing the job. The net effect of these two pulls is the bid’s expected profit.
Step 6: Selecting the Final Price
Pricing methods narrow the range from which the company must select its final price. In selecting that price, the company must consider additional factors, including the impact of other marketing activities, company pricing policies, gain-and-risk-sharing pricing, and the impact of price on other parties.
Impact of Other Marketing Activities The final price must take into account the brand’s quality and advertising relative to the competition. When Paul Farris and David Reibstein examined the relationships among relative price, relative quality, and relative advertising for 227 consumer businesses, they found that brands with average relative quality but high relative advertising budgets could charge premium prices because consumers were willing to pay more for known products.23 Brands with high relative quality and high relative advertising obtained the highest prices. Conversely, brands with low quality and low advertising charged the lowest prices. For market leaders, the positive relationship between high prices and high advertising held most strongly in the later stages of the product life cycle.
Company Pricing Policies The price must be consistent with company pricing policies. Although companies may establish pricing penalties under certain circumstances, they should use them judiciously and try not to alienate customers. Many companies set up a pricing department to develop policies and establish or approve decisions. The aim is to ensure salespeople quote prices that are reasonable to customers and profitable to the company.
Gain-and-Risk-Sharing Pricing Buyers may resist accepting a seller’s proposal because they perceive a high level of risk, such as in a big computer hardware purchase or a company health plan. The seller then has the option of offering to absorb part or all the risk if it does not deliver the full promised value. An increasing number of companies, especially B-to-B marketers, may have to stand ready to guarantee any promised savings but also participate in the upside if the gains are much greater than expected.
Impact of Price on Other Parties How will distributors and dealers feel about the contemplated price?24 If they don’t make enough profit, they may choose not to bring the product to market. Will the sales force be willing to sell at that price? How will competitors react? Will suppliers raise their prices when they see the company’s price? Will the government intervene and prevent this price from being charged? For example, it is illegal for a company to set artificially high “regular” prices, then announce a “sale” at prices close to previous everyday prices.

