Example for mitigation options: alternative routing
Currently a number of options to mitigate the climate impact of air traffic are discussed. They include technical changes, such as the open rotor concept, alternative fuels such as biofuels and liquid hydrogen, more efficient air traffic management and climate friendly routing. Most options are associated with increased fuel efficiency. An exemption is climate optimised routing, where a trade-off between CO, and non-CO, impacts is regarded. A strong decrease in non-CO, impacts is achieved at a relatively low expense of CO, emissions and hence decreases in fuel efficiency. The implementation of those options requires supporting economic measures.
Koch (2013), Dahlmann (2012) and Dahlmann et al. (2016) presented a study, which combines aircraft design, engine performance, trajectory calculation, cash operating costs and climate impact calculations. They focused on the roughly 1200 international routes, flown with the Airbus 330—200 in 2006. A variation of both speed (faster and slower) and initial cruise altitude (higher, when possible and lower) shows that there is a potential to reduce the climate impact (here: ATR. over 100 years applying emissions over the aircrafts whole life span) by flying generally lower (Figure 2.6, dashed curve). In Figure 2.6 the current relation between the fleet s costs (fuel and crew) and the climate impact is normalised by 1 each. It shows that a 30% climate impact reduction can be achieved by flying lower at an increase of costs of around 5%. A higher climate impact reduction is feasible, though at much higher costs.The aircraft, however, was not initially optimized for that cruise altitude and speed. Hence, when redesigning the aircraft (Figure 2.6, left), it becomes much more efficient at this lower flight altitude, and a reduction of the climate impact of 30% without any increase in costs is feasible (Figure 2.6, solid line).
This approach takes into account not a rerouting for specific weather situations, but a general change in the aircraft trajectory which is applied to all

Figure 2.6 Example of aircraft design and fleet composition. Left: Design of an Airbus 330-200 and redesign for lower flight altitude and speed. Kight: Optimal cost-benefit relation for two fleets of aircraft: the original aircraft (dashed) and redesigned aircraft (solid). Costs are given as relative changes of the cash operating costs (fuel and crew) and benefits are given in relative changes of the average temperature response over 100 years for cruise emission during the lifespan of the aircraft. Values are relative to the aircrafts reference trajectories.
Source: Figures are taken from Dahlmann et al. (2016).
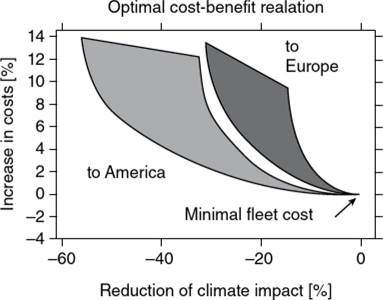
Figure 2.7 Relation of economic cost changes and climate impact changes for trans-Atlantic air traffic of one specific winter day. Relations for westbound and eastbound flights are in light and dark grey, respectively. Several climate metrics are used to indicate ranges (shaded area).
Source: Figure based on results from Grewe et al. (2014).
weather situations. However, since the non-CO, effects are often very regional, especially the formation of persistent contrails, it is worth considering changes in the aircraft trajectory, which take into account the specific weather situation and the variations in the climate impact from aircraft emissions depending on the location and time of these emissions. Grewe et al. (2014) analysed for one day the trans-Atlantic air traffic, i.e. roughly 400 flights in either direction. They changed the vertical and lateral routing to obtain a smaller impact on climate and found large reductions in the climate impact of about 25% with an increase in costs (mainly fuel) of 0.5% for westbound flights (Figure 2.7). The jet stream for that day was very west-east oriented. This implies that eastward flights largely profit from the jet stream’s tail winds and that leaving the jet stream area includes large penalties for fuel consumption, emissions and climate impact. On the other side, westbound flights, which avoid the jet stream, have more routing options and hence a much larger climate reduction potential. However, taking all occurring weather situations into account, this difference of climate impact depending on the flight direction is becoming significantly smaller (Grewe, Matthes, et al., 2017).
Summary
Emissions from air traffic contribute to climate change via a number of atmospheric processes which alter the abundances of so-called climate agents. Besides CO,, there are impacts from contrail-cirrus, NO emissions which lead to ozone formation and methane depletion, water vapour and particles. The atmospheric processes are complex, and although for many processes there is a good understanding and a good observational basis, the quantification is associated with large uncertainties. One reason is the large variability of the atmosphere. A detailed description of the air traffic related atmospheric changes can be found in Lee et al. (2010) and Grewe, Dahlmann, et al. (2017).
A number of options to mitigate the air traffics climate impact are currently discussed. Most mitigation options are concentrating on the reduction of the CO, emissions, e.g. by introducing more efficient technologies or alternative fuels such as biofuels. A mitigation option, which appears more intriguing, is making use of the high variability in space and time of non-СО, climate impacts, simply by avoiding regions which are very climate sensitive, i.e. re-routing.

