Gabheni Creek
This creek flows on the southern side of GIDC Sachin and does not officially receive treated effluents from any CETP or treated sewage from any STP. The creek used to be monitored during the period from 2008 to 2010 but this was discontinued later on. From the parameters measured, pH is found to be within the permissible limits. The average value for BOD observed in the creek is 298.3 mg/1. The highest reading for BOD is 672 mg/1. This is very high when compared to the acceptable limits of< 3 mg/1. This is quite a surprising finding as the creek does not officially receive any industrial or sewage discharge. The high level of pollution indicates that there are illegal discharges into this creek.
The observation of illegal discharges was reinforced by a news item as far back as 2011, when the Press Trust of India (PTI, 2011) reported illegal discharge from the common hazardous waste facility into the Gabheni khadi and the death ofbuffaloes from drinking the polluted water. The DTE (2015) too has reported on the illegal discharge of hazardous wastes by GEPIL (the company which runs the common hazardous waste facility in Surat) into the khadi. Even recently, the Times of India (TOI, 2019) has reported that the textile units and the chemical units in GIDC Sachin have set up illegal pipelines to discharge their effluents into storm drains. The news quotes a senior officer of the Sachin Notified Area Authority as stating:
We are in the know of illegal practice going on in the GIDC, but the mill owners have a strong lobby. We have taken up cleaning of the storm drains and if any illegal network is found, we will report it to the GPCB authorities for action.
This indicates years of apathy on behalf of the regulator and a complete disregard for the environment by the polluters (Figure 9.3).

FIGURE 9.3 BOD in the Gabheni Creek. Source: Unpublished data from GPCB.

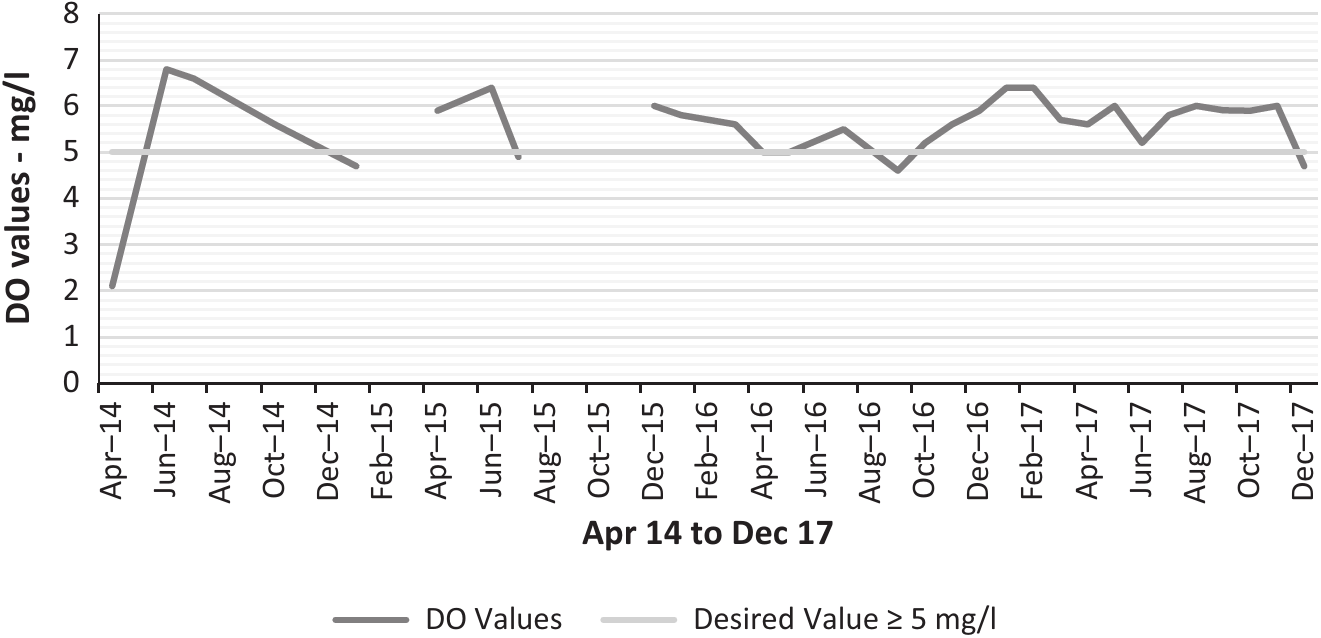
FIGURE 9.4 DO in the Baleshwar Creek. Source: Unpublished data from GPCB.
Baleshwar Creek
This is the only creek which is regularly monitored by the GPCB and for which time series data is available. The Baleshwar creek receives the treated effluent from CETP GETPL (Gujarat Eco Textile Park Ltd.) and joins the Mindola river, finally flowing into the Mindola estuary and then the Gulf of Khambat. From the list of parameters, the pH is observed to be within limits. The analysis for DO and BOD is represented in Figure 9.4 and Figure 9.5 respectively.
The levels of DO are observed to be generally above the desired value of > 5 mg/1, with a few exceptions (Figure 9.4). The average DO is observed as 5.5 mg/1 for the study period. The break in the trend line is due to the unavailability
FIGURE 9.5 BOD in the Baleshwar Creek. Source: Unpublished data from GPCB.
of data for those months. Even the BOD levels are observed as less than the desired value of < 3 mg/1 most of the time (Figure 9.5) and the average BOD value is only 2.1 mg/1. The irony of the situation is that the creek which does not have high pollution levels is regularly monitored, whereas the other ones, receiving most of the pollution from the city and having a degraded water quality, are no longer monitored. This is essentially turning a blind eye and avoiding a situation which one does not wish to acknowledge.

