Phonon and Plasmon–Phonon Interactions in ZnO Single Crystals and Thin Films
Oleksandr Melnichuk, Lyudmyla Melnichuk and Evgen Venger
INTRODUCTION
Optics of the surface of solids is the field of materials science that attracts considerable attention. It had arisen in the past millennium and it still continues its development. This considerable interest is governed by optical phenomena appeared due to the interaction of electromagnetic waves with lattice vibrations and charge carriers in materials.
The investigation of elementary excitations (such as phonons, plasmons, and polaritons) and their interactions with different materials and structures is one of the interesting problems of modem surface physics. The first theoretical consideration of elementary excitations such as polaritons was performed by K.B. Tolpygo (Tolpygo, 1950) who together with G.I. Pekar called them as “light-excitons.” Later, J. Hopfield proposed the term “polaritons” for such excitations (Hopfield, 1958). Another type of such excitations, known today as “phonon polaritons,” and their dispersion relation was also reported by Tolpygo in 1950 (Tolpygo, 1950) and, independently, by K. Huang in 1951 (Huang, 1951) for ionic crystals.
Surface plasma waves, that is, collective charge carrier motion (also called as surface plasmons (SPs)), are transverse magnetic electromagnetic waves, traveling along interfaces of two different media. The guiding of such surface waves can be considered in similar manner as light guiding in an optical fiber. The highest amplitude of electric field is observed on the solid surface being exponentially decreased from the interface toward media volume.The first study on surface plasmon-polaritons (SPPs), which are the result of the coupling of SPs with light whose wavelength depends on material nature and its geometry, was performed by A.Z. Otto in 1968 (see, for instance, Otto, 1968). SPPs are characterized by shorter wavelength than that of incident light (photons). They can have tighter spatial confinement and higher local field intensity. In the direction perpendicular to the interface, they have subwavelength- scale confinement. SPPs will propagate along the interface until their energy will be lost due to either absorption in the material (metal, semiconductor) or scattering into other directions (such as into free space).
SPPs can be both radiative and nonradiative. Radiative ones, being coupled with plane electromagnetic waves, are involved in emission process or plasma-resonance absorption. Nonradiative SPPs are known as solutions of Maxwell’s equations (their theory concerns the consideration of the complex dielectric function) and result in total reflection. Both types of SPPs have different applications, for instance, in subwavelength optic microscopy or lithography beyond the diffraction limit, in photonic data storage, light generation and biophotonics, in the determination of electrophysical parameters of materials such as carrier concentration, mobility, and conductivity, or even in the measurement of a fundamental property of light itself such as the momentum of a photon in a dielectric medium. The investigation of such excitations and their collective interactions allowed to study not only inorganic solids, but also the organic ones and to develop different sensors. Recently, it was reported that specific light form, which may involve polaritons, could be useful in the development of quantum computers (Liang et ah, 2018).The SPs and SPPs in isotropic solids have been studied in detail (see for instance, Agranovich & Mills, 1985; Dmitruk. Litovchenko, & Stryshevskii. 1989; Tarkhanyan & Uzunoglu, 2006; Venger. Melnichuk, & Pasychnik, 2001; Vinogradov & Dorofeev, 2009). How'- ever, such excitations and their interaction in anisotropic crystals were less addressed due to the difficulties appeared in the theoretical modeling of these excitations (Agranovich & Dubovskii. 1965; Melnichuk, 1998; Melnichuk, Melnichuk. & Pasechnik, 1998; Melnichuk & Pasechnik, 1998; Venger et al., 1995). Indeed, contrary to the consideration of isotropic solids, the modeling of dispersion relations of anisotropic ones requires to involve additional characteristic parameters, that is. the anisotropy of the dispersion laws of surface plasmon-phonon polaritons (SPPPs), effect of free carrier concentration and optical axis orientation with respect to SPPP propagation direction on the number of dispersion branches, anisotropy of damping coefficients of ordinary and extraordinary SPPP, and so on.
There are several techniques used to investigate phonon and plasmon systems of materials as well as the plasmon-phonon coupling. Among them, the most addressed are high-resolution electron energy loss spectroscopy and inelastic neutron scattering. Coupled w'ith theoretical calculations, these techniques provide relevant information on free-carrier concentrations in the bulk and in the subsurface regime, band bending, phonon frequency dispersions, electron mobility, and plasmon damping for homogeneously doped materials. However, both techniques require specific complex equipment. In this regard, optical methods such as Raman scattering and infrared spectroscopy become more attractive. These methods are nondestructive and sensitive to materials' nature.
Among different approaches of infrared spectroscopy used for the investigation of elementary excitations and their interactions, the most attractive are specular infrared reflection (1RR) and attenuated total reflection (ATR). Both of them are sensitive to the interaction of the plasmons with the phonons because their coupling affects significantly the shape of the 1RR and ATR spectra in the range of residual rays when the plasmon frequency (vp) is approaching the frequency of longitudinal optical phonon (vL). Modeling of these spectra allows, for instance, the concentration and mobility of free carriers, as well as material conductivity to be determined in semiconductor materials.
For the modeling of the 1RR and ATR spectra in the range of residual rays of corresponding materials, the dielectric permittivity of the whole system is represented by the sum of the “phonon” and “plasmon” terms taking into account plasmon-phonon interaction (Melnichuk, 1998; Venger, Melnichuk. Melnichuk, & Semikina, 2016). When vp < vL, such interaction is insignificant, thus for the modeling of 1RR spectrum only the contribution of phonon subsystem in dielectric permittivity of the material can be used. By contrast, for vp > vL, both “phonon” and “plasmon” terms are important. Otherwise, significant discrepancy will appear between the theoretical simulation and experimental spectra in the range of “residual rays” of the investigated materials.
In this chapter, main attention will be paid to theoretical consideration of surface polaritons and SPPPs in anisotropic materials. Besides, the effect of magnetic field on such collective excitations will be considered. As an example of anisotropic materials, zinc oxide (both single crystals and thin films) will be addressed.
ZnO has wurtzite structure with the C%r(P6jmc) space group and show's strong anisotropy of the properties of the phonon and plasmon-phonon subsystems (Dmitruk et al., 1989; Kuzmina & Nikitenko, 1984; Venger et al., 2001). It attracts much attention among different polar materials because of the combination of unique optical, mechanical, and piezoelectric properties. This wide-bandgap semiconductor (Eg = 3:37 eV) possesses high chemical inertness and durability in ambient conditions (Ellmer, Klein, & Rech, 2008). The growth of ZnO single crystals is a complicated process that requires a specific high- temperature equipment. Due to some technological difficulties in the growth of ZnO crystals and, as a consequence, their high cost, the production of ZnO films becomes more attractive today. One of the advantages of ZnO films is their capability to keep typical properties of single crystals. Another one is the possibility to grow with high structural quality at low temperature (even at room or near-room temperature) (Fortunato et al., 2005); Gieraltowska, Wachinski. Witkowski. Godlewski, & Guziewicz, 2012). These films can be used in different optical devices such as light-emitting devices, optical detectors, as well as in solar-cell windows, ultraviolet detectors, and so on (Ellrner et ah, 2008; Fortunato et ah, 2005).
One of the specific feature of ZnO is high anisotropy of phonon system and a low anisotropy of plasmon one. Consequently, the interaction of long-wavelength optical vibration of the lattice with electron plasma in ZnO materials will be different for the cases E±c and Ec. This will affect IRR spectra obtained for both the orientations and their analysis permits to reveal the anisotropy of optical and electrophysical properties of these materials. Such effect was earlier demonstrated for pure and doped ZnO single crystals (Venger et ah, 2001), as well as for pure and rare-earth-doped ZnO films grown semiconductor and insulating substrates such as 6H-SiC, Si, Si02, and A1202 (Korsunska et ah, 2019; Melnichuk, Melnichuk, Korsunska, Khomenkova, & Venger, 2019; Melnichuk, Melnichuk, Tsykaniuk, et ah, 2019; Venger et ah, 2001. 2016). Using nondestructive and fast enough IRR method, free carrier concentration and their mobility as well as damping coefficients were estimated for such textured films when the results of direct electrical measurements were controversial due to a specific, column-like structure of the films (Korsunska et ah, 2019; Melnichuk, Melnichuk, Tsykaniuk, et ah, 2019).
7.2 SPPPS IN ZINC OXIDE SINGLE CRYSTALS
The study of the influence of strong anisotropy of the crystal lattice and weak anisotropy of the effective mass of electrons on the excitation and propagation of nonradiative SPPPs in uniaxial semiconductors has attracted the attention of the researchers only in last decade. Hereafter, the theory of the propagation of electromagnetic waves in hexagonal ZnO single crystals will be considered. The relationship of surface electromagnetic waves with plasma oscillations of free charge carriers (electrons) and with long-wavelength optical lattice vibrations is reported. It should be noted that the developed theoretical models can be implemented for the determination of the optical and electrophysical parameters of not only undoped and doped ZnO single crystals and thin films, but also of other anisotropic materials.
7.2.1 General Theory of Surface Plasmon-Phonon Polaritons in Anisotropic Crystals
The theory of SPPPs in anisotropic crystals was described by Gurevich and Tarkhanyan (1975) and developed later by Tarkhanyan and Uzunoglu (2006). According to this theory, a uniaxial crystal occupies the region г < 0, and the optical axis of the crystal lies in the xz plane and has an angle в with the z axis. Then, the tensor of dielectric constant c^fv) has the form presented by Eq. (7.1):

where and f. are the components of /;,Д v), which in the region of plasmon phonon interaction (without decay) are given by the expressions (7.2) - (7.4):

where v is the frequency (in cm-1), £тсх,ц and e0x>|| are the main values of the high- frequency and static permittivity tensors perpendicular and parallel to the C-axis; vrj_,|| and vT, л are the frequencies of transverse and longitudinal optical phonons; /1х_ц are the main values of the dimensionless tensor of the inverse effective mass.
When the wave vector of surface vibration К is perpendicular to the C-axis (/LlQ and xyC (в = tt/2), the SPPP is characterized by the dispersion relation:

In this case, the dispersion of surface waves is determined by dielectric function ex(v) only, when £y(v) < — 1.
It will be considered only the solutions of Eq. (7.5) for which> 1 (K>co/c), where со is the angular frequency and c is light velocity), that is, non-radiation SPPPs. In this case, two branches of SPPP appear. The high-frequency branch v+ begins at the point v = vn. With the К increasing (K»colc), the frequency v approaches asymptotically the value:

this corresponds to the solution of the dispersion equation in the case of no delay of ex = -1 (biquadratic equation). The low-frequency branch v“ exists for all К values, and the SPPP frequency v increases with К rising from zero to the solution of Eq. (7.6) taken with sign
For K±C, xy±C (в - 0), the SPPPs are characterized by the dispersion relation:
 and inequalities:

The condition (7.8) along with (7.7) is correct either for ец >xl or for ец < - (l/|cj_|), that is,

This case differs qualitatively from the isotropic one, that is, new SPPP branches appear. Their number and the range of existence depend on the concentration of the electrons in the conduction band as well as on the values of гХх,ц, v> , ц, уРх>ц, vx ||+’“, and £2х.ц+’- that are determined by the relations:

and

For a given К value, the maximal number of branches is 4. The curves v = v,(K) (i - 1-4), that are the solution of Eq. (7.7), increase with К rise and at K»colc that approach asymptotically the frequencies on the surface phonons corresponding to the solutions of the equation

However, only the segments of the dispersion curves that lie in the (v, K) plane and for those the condition (7.8) is satisfied, correspond to the surface waves. Equation (7.12) is a fourth-order one with respect to v”, but only one, two, or three solutions lie in the range where ex < 0. Consequently, three, two, or one of the dispersion curve(s) end at finite К values, whereas the number of such solutions depends on the concentration of electrons in the conduction band.
Hereafter, the effects mentioned above will be discussed, at first, for different ZnO single crystals grown by hydrothermal method. Their electrophysical parameters such as carrier concentration (n0), their mobility (/0 and effective masses (m± * and mt*), as well as conductivity (
7.2.2 The Effect of Anisotropy on the High-Frequency SPPP Dispersion in Zinc Oxide
In this section, the effect of the crystal anisotropy on the SPPP dispersion dependences is discussed for three different orientations of hexagonal ZnO. Figure 7.1a (symbols) shows three experimental dispersion curves of vs(X), obtained for ZnO crystal with electron concentration «о = 9.3 x 1016 cm-3 (sample Z02-3, Table 7.1). They are plotted versus the dimensionless wave vector q = Kc/coT, where К is the SPPP wave vector, c is the light speed, and coT|| is the angular frequency of the transverse optical ZnO phonon when the vector of electric field of the infrared radiation E is parallel to the C-axis (E||C).
The high-frequency v+ branches of SPPPs were obtained in accordance with Eqs. (7.5) and (7.7), taking into account the anisotropy of electron effective mass in ZnO (Melnichuk, 1998; Venger et al., 2001). Curve 1 corresponds to the case /f||C and xyC (.v and у axes lie on the surface of the sample), whereas curve 2 was obtained at KA.C and xy±C. Both these dependences are the features of extraordinary SPPPs. The ordinary SPPPs are manifested in
TABLE 7.1
Electrophysical parameters of ZnO crystals grown by hydrothermal method
|
Sample |

|

|

|

|

|
||

|

|

|

|
||||
|
Z02-3 |
9.3 x 10¹⁶ |
150 |
167 |
22 |
25 |
0.21 |
1.23 |
|
ZOl-3 |
6.6 x 10¹⁷ |
80 |
96 |
85 |
101 |
0.23 |
1.13 |
|
Z06-B |
2.0 x 10¹⁸ |
74 |
50 |
237 |
243 |
0.22 |
1.18 |
|
ZC1M |
4.2 x Ю18 |
2.2 |
— |
148 |
— |
— |
— |
|
Z09 |
5.0 x Ю19 |
1.5 |
— |
1250 |
— |
— |
— |
TABLE 7.2
Self-consistent parameters for ZnO single crystals used for theoretical simulation

|

|

|

|
|

|
8.1 |
3.95 |
412 |
591 |

|
9.0 |
4.05 |
380 |
570 |
the orientation КJ.C and xy±C (curve 3). As one can see, the experimental results and their theoretical simulation are in a good agreement (Figure 7.1).
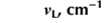
The optical parameters of ZnO (such as £x(v) and ец(у)) (Table 7.2) were obtained based on the dispersion analysis of 1RR spectra, taking into account the anisotropy of electron effective mass (Table 7.1). The plasma frequencies of free carriers vpx and урц are linked by the relation

where шх,ц is the transverse and longitudinal effective mass of electrons. Since for ZnO т*±/тТ, = 1.15, hence урц = 1.1 vpx. The frequencies of plasmon-phonon oscillations are ypf = 548 cm-1 (curve 2) and 561 cm-1 (curve 3) when the plasma frequencies vpx = 90 cm-1 and vp|| = 100 cm-1 (I£±C. EC). The anisotropy of SPPPs manifests itself at Kc/coy > 2. Thus, when Kclcor - 2, the difference 5v = 18 cm-1 is seen between curves 1 and 3. At the same time, when A7->0, curves 1 and 2 tend to achieve the frequency vpf = 548 cm-1.
The inset (a) in Figure 7.1 shows in detail the segment of the vs(/0 dependence in the 380 420 cm-1 range. It is seen that up to v = 412 cm-1, the SPPPs of the second type are manifested. Their existence is limited by the conditions ex(v) < 0 and cz(v) > K~. The symbols represent the experimental data that are consistent with calculated ones (solid curve). The SPPPs of type 1 start at v = 412 cm-1 when ex(v) < 0 and t;z(v) < 0.
Since the experimental dependence vs(AT) represented by curve 1 in Figure 7.1 is a continuous line, for its modeling, it was considered the extremum value at у = 412 cm-1 as “stop point.”
Figure 7.1b represents the experimental ATR curves obtained for the same ZnO crystal (curves 1-5) at different air gaps between ATR crystal and ZnO surface and the angles of IR light incidence. The minima on these spectra corresponds to the frequencies vm;n = 408, 450, 496, 518, and 527 cm-1, whereas their width are Tp = 32, 27, 22, 17, and 15 cm-1, respectively. The modeling of the ATR spectra was performed for the orientation /f||C and xyC in the extremum vicinity, that is near v = 412 cm-1. Consequently, for the SPPPs of types 1 and 2, it was performed for vspi = 413 cm-1 and vp2 = 411 cm-1 taking into account the damping

FIGURE 7.1 (a) Dispersion curves vs(K) for the SPPPs of ZnO crystal with electron concentration of
«о = 9.3 x 10l6cm^3. The orientation of wave vector and C-axis is (I) A"||C and .yy||C; (2) KLC and xy±C; (3) K±C and xyC . Inset (a) shows curve I in detail in the range v = 380 — 420cm 1; /f||C and ,vy||C. (b) ATR spectra of the same crystal recorded with an air gap 26 pm (1,2) and 3 mm (3-5), and the angle of incident light of a = 25.3° (1), 28° (2) 34° (3), 42° (4), and 52° (5). Curves 6 and 7 were calculated with d =12 pm, a = 25.2° (6) and d = 49 pm, a = 25.7° (7) and demonstrate the presence of SPPPs of type 1 (7) and type 2 (6). Curve 8 is the modeling performed for the ZnO crystal with electron concentration n0 =
4.2 x 10ls cm 3 that demonstrates the polaritons of type 3.
Reproduced with permission from Melnichuk ct al. (1998). Copyright 1998 Springer Nature coefficient of transverse optical phonons yf — 11 cm-1 (Melnichuk, Melnichuk, & Pasechnik. 1994). Here, according to Eq. (7.5), the values of /fspl and Ksp2 were 1.11054 and 1.10415, respectively. Both theoretical spectra were found to have the same intensity in the minimum and the same width Гр = 12 cm-1. The spectra practically overlap indicating that surface polaritons of both types can be generated simultaneously in the presence of damping at an emission frequency of 412 cm-1. The experimental spectrum with a minimum at vmj„ = 408 cm-1 and its width of Tp = 32 cm-1 (Figure 7.1b, curve 1) corresponds to the damping coefficient of SPPPs Tsp = 4 cm-1. The cutoff frequencies are determined by Eq. (7.11).
Polaritons of type 2 can be observed only when < 0 and ец > Kx2 (Gurevich & Tar- khanyan, 1975; Melnichuk et al., 1998). For ZnO crystals, the existence region of polaritons of type 2 is in the range 380^412 cm-1 (Figure 7.1a). They are exhibited when the orientation of the sample corresponds to KC and xyC as it was demonstrated experimentally by Melnichuk et al. (1998) for the first time.
One more interesting excitations is the polaritons of type 3 that can be present only in anisotropic crystals with the carrier concentration above a certain value (higher than) no = 2 x 10l8cirT3 (Melnichuk et al., 1998). For instance, in ZnO crystals with
no = 4.2 x 1018 cm 3and it is by ATR spectrum (curve 8 in Figure 7.1b). The existence region lies in the low-frequency range and corresponding dispersion curves vs(K) for such polaritons are bounded by the straight lines ец = 1, ex = 0 and со = Kc (as it will be discussed later).
7.2.3 Low-Frequency Dispersion Dependences of SPPPs of Hexagonal ZnO
In the isotropic case, an ordinary polariton has one low-frequency v" branch. It begins at v = 0 and increases up to v“ when К —> oo. The dispersion curves of the surface polaritons have two branches: v+ ~( K). Figure 7.2 shows such curves of ZnO when K±C and xyC. With this orientation, ordinary polaritons appear. The calculation of these dependences was performed for the samples with different carrier concentrations: Z02-3 («о = 9.3 x 1016 cm-3) and ZOl - 3 (no = 6.6 x 1017 cm-3) (Table 7.1). For sample Z02-3 (curves 1 and 2), the parameters were vpx - 90 cm-1, v,,j + = 561 cm-1, and vpf = 59 cm-1 (Кс/®тц —* oo), whereas for sample ZOl-3 (curves 3 and 4): vpx = 240 cm-1, vpr+ = 578 cm-1, vpf_ = 152 cm~x (Kc/coT|| —> oo). Index “pf” is used for SPPP boundary conditions corresponding to the values v+~ obtained from Eq.(7.6). These calculations showed that SPPP frequency is higher when the concentration of free carriers is higher (electrons for ZnO). All curves in Figure 7.2 correspond to the SPPP of type 1 that exist at any values of x > 1 (Bryksin, Mirlin, & Firsov, 1974).
Let us consider the case 0 = 0, when K±C and xyj.C. For ZnO. the interrelation of the frequencies is vT|| < vtj. < vLM < vLx. Dispersion curves vs(K) begin at the frequencies v = 0; v = vTx (e_L = oo) and v = £2+, v = Пу (ец = 1), which are on the straight line (light line) w - Kc. As
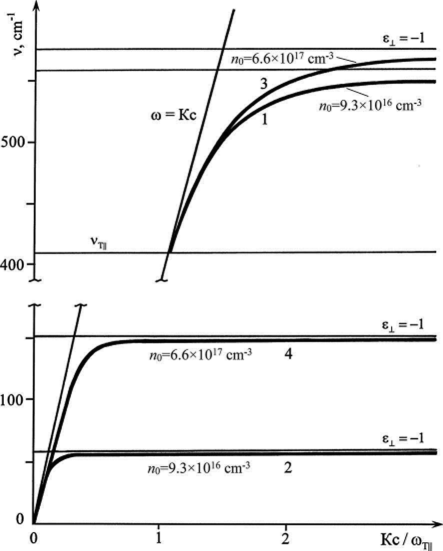
FIGURE 7.2 Dispersion curves vs(K) for the SPPP ofZnO crystals with orientation K±C and xylC; 1,2 - vpl = 90 cm 1 (sample Z02-3, n0 = 9.3 x 1016 cm 3); 3, 4 - vpi = 240 cm 1 (sample ZOl-3, nu = 6.6 x Ю17 cm 3); 1 - vpf+ = 561 cnT1; 2 - vpf" = 59 cm 3 - vpf+ = 578 cm-1; and 4 - vpf _ = 152 cm-1
mentioned above, under certain conditions, up to four dispersion branches vs(AT) are possible for an uniaxial semiconductor. At К » cole, their number varies being depending on carrier concentration.
However, if for ZnO crystals the condition

is failure then existence of only three dispersion branches vs(AT) is possible.
Figures 7.3-7.6 show the dispersion dependences of ZnO with different carrier concentration for the orientation of K±C and xy±C. It is seen from Figure 7.3 that for negligible carrier concentration («о = 4.0 x 10l5cm-3, vp = 1 cm-1), only the high-frequency vs(AT) is observed being started at v = vr± = 412 cm-1 and asymptotically approaches the value of vpf+ = 545.1 cm-1 at Кс/соХц —> oo. This dispersion curve corresponds to extraordinary SPPPs of type 1 since they exist when i:±_ < 0 and сц <0, and the existence of vpf+- for К.с/соТц —> oo.
Figure 7.4 shows the dispersion dependence vs(K) of Z02-3 sample with electron concentration n0 = 9.3 x 1016 cm-3 when K±C and xy±C, vpx = 90 cm- and vp^ = 100 cm-1. In

FIGURE 7.3 Dispersion curve >S(K) for SPPPs of ZnO (n0 = 4.0 x 1015 cm 3) for orientation KlC and xy±C; VpX = 1 cm , = 1.1 cm 1. vpf+ = 545.1 cm 1

FIGURE 7.4 Dispersion curves vs(K) of the SPPPs in ZnO (sample Z02-3, n0 = 9.6 x 1016 cm 3) with orientation KlC and xy±C; vpx = 90 cm-1; урц = 100 cm-1: 1 - vpf+ = 548 cm-1; 2 - vpf“ = 60 cm-1
this case, two branches vs(AT) of the SPPPs of type 1 appear approaching the values of vpf+ = 548 cm-1 and vpf" = 60 cm-1 at Кс/сощ —» oo. Curve 2 has the features that are characteristic for plasma polaritons.
Figure 7.5 shows the vs(AT) curves for ZnO crystal with higher electron concentration (sample ZC1M, n0 - 4.2 x 1018 cm-3) for the same orientation and vpx = 605 cm-1 and Vp,, = 650 cm-1. The calculation shows the presence of three dispersion dependences (curves 1-3) with the next parameters: vpf+ = 719 cm-1 (curve 1) and vpf” = 305 cm-1 (curve 2). Curve 3 is shown in detail in Figure 7.5b. It is seen that it begins at a frequency of Q|l = 309.9 cm-1 at Кс/а>т = 0.815 (ец = 0) and ends at a frequency of vx_ = 318.4 cm-1 at Kc/toT = 1.632 (e± = 0).
Further increase of carrier concentration results in the transformation of the dispersion curves of the SPPPs of type 3. Figure 7.6a shows such dependences for ZnO crystal with 770 = 8.0 x Ю18 cm-3, where vpx = 1300 cm-1 and v,,,, = 1430 cm"1. In this case, vpf+ = 1273.7 cm-1, and vpr” = 363.58 cm-1 at АГс/штц —* °o. The curve vs(AT) starts at a frequency of v3 = 363.8 cm-1 and tends to the value v3 = 390 cm-1 at Kc/cojц —» 0 (Figure 7.6a, curve 3). The calculation of vs(AT) for ZnO with higher electron concentration (nQ = 2.0 x Ю19 cm-3, vpx = 1500 cm-1 and vp,, = 1650 cm-1 ) is presented in Figure 7.6b. Here, vpf+ = 1450 cm" , vpf” = 367.7 cm-1. The cutoff frequency of the dispersion dependence is at v = 395.5 cm"1 (curve 3).
Thus, the behavior of the third branch of the dependence vs(K) for ZnO crystals differs from that observed previously in anisotropic crystals. Using the data obtained for the ZC1M sample (Figure 7.5), the ATR spectrum of the SPPPs of type 3 was calculated (Figure 7.7). This spectrum was obtained at = y^ = 6 cm-1 and yPL = у = 1 cm"'and an angle of light incidence in the ATR element a - 28°, and the air gap width between the element and the sample cl = 26 pm. The minimum intensity of the spectrum was at frequency v = 312.5 cm”1 at Kc/coT = 0.92. An increase in the damping coefficients of phonons and plasmons in ZnO leads to a decrease of the spectrum amplitude.

FIGURE 7.5 (a) Dispersion curves vs(/Q for SPPPs of ZnO when KiC and xy±C; vpj_ = 605 cm vp|| = 650 r/H-l(sample ZC1M, n0 = 4.2 * 10IX cm"3); (b) the detailed presentation of curve 3. =
318.4 cm"'; Kc/coj = 1.632 (ex =0); Пц = 309.9cm"1; Кс/со-щ =0.815 (ец = 1); vp- =306.5 cm"1; Kc/coj^ = 0,017(ец = 0)
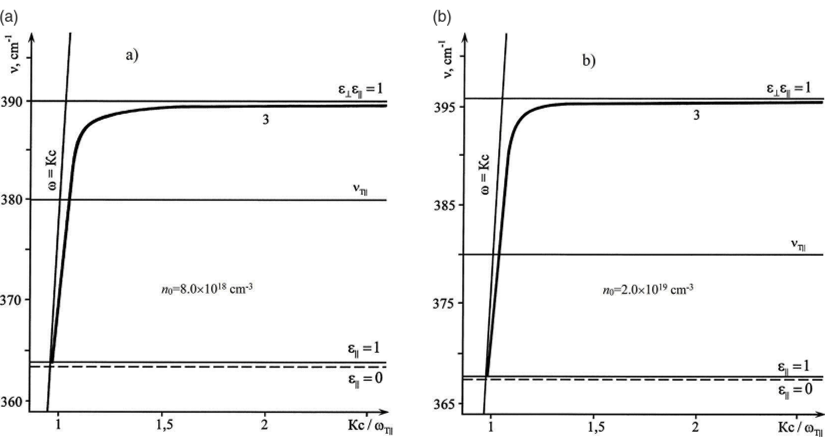
FIGURE 7.6 Dispersion curves vs(K) for SPPPs of type 3 in ZnO with n0 = 8.0 x 101!i cm 3 (a) and n0 = 2.0 x 1019 cm 3 (b) when K±C andxylG
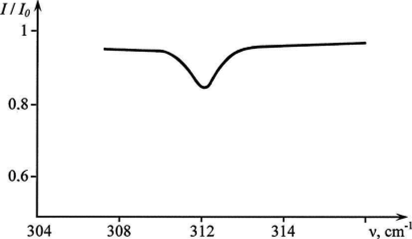
FIGURE 7.7 ATR spectrum of ZnO crystal (sample ZC1M, n0 = 4.2 x Ю18 cm 3). Calculation parameters are: lfL = //у = 6 cm-1, ypl = ypу = 1 cm-1, a = 28°, d = 26 pm.
7.2.4 The Comparison of Experimental and Theoretical Data
The analysis of these results showed that the SPPPs of type 2 can occur only when ex < 0 and £|| >/д. (Eq.(7.8)). In the case of ZnO. the range of the existence SPPPs of type 2 is limited by frequencies of 380^412 cm-1 (see Figure 7.1a). They appear when the orientation of the sample is /f]|C and xyC. The dependence vs(/Q practically represents a straight line passing towards the vs(K) of the SPPPs of type 1.
With orientations K±C, ЛЦС, and .vy||C, the extraordinary SPPPs are excited, which is manifested in the two-component spatial structure of their fields. In Figures 7.3-7.5, in the v,Kc/cotу coordinates, the regions, where condition (7.8) is fulfilled and the dispersion dependences of the SPPPs are observed at в - 0 and v-гц < vn < сц
The particular interest should be paid to the dispersion dependences vs(AT), related to the SPPPs of type 3, which manifest themselves only in anisotropic crystals at concentrations of free carriers higher than a certain boundary value. In the case of ZnO, this threshold value is nQ = 2 x Ю18 cm-3 (Melnichuk et al.. 1998; Venger et ah, 2001). The spectral range of the existence of these SPPPs is framed by the straight lines £ц = 1, со = Kc and cx = 0. Figure 7.5 corresponds to the case vo
According to Gurevich and Tarkhanyan (1975); Tarkhanyan and Uzunoglu (2006),

where wx is reduced electron mass. Since for ZnO crystals, тл * = 0.26me (Melnichuk et ah, 1994; Venger, Melnichuk, Melnichuk, & Pasechnik, 1995), then /»x - (1 l/ij_)me and, consequently, //x = 3.85. Thus, from Eq. (7.15), v0 = 1.0129vpx and V| = 1091.17 cm-1 are obtained. If v0 = vi, then vpx = 1077.27 cm-1. Since £2ц > 301.1 cm-1, the SPPPs of type 3 begin to appear at vpx > 550 cm-1.
Figure 7.5b shows the dependence vs(AT) for SPPPs of type 3 for ZnO crystal with n0 - 4.2 x Ю18 cm-3 (sample ZC1M, Table 7.1) where vpx = 605 cm-1. In this case, vjf = 306.5 cm-1, Kclco = 0.017 (cy = 0); Q.f = 309.9 cm-', Kclco = 0.815 (ey = 1), vx“ = 318.4 cm-1, and Kclco = 1.632 (cx = 0).
Thus, the SPPPs of type 3 exist in the frequency range of v = 309.9-318.4 cm-1 for this sample. Corresponding dispersion dependences vs(K) (Figure 7.7) were obtained for K±C, xy±C and vo > vi (v_i_— >V741) with cutoff frequencies V3 = 390 cm-1 and 395.5 cm-1. When (vj.- >vt-||), the SPPPs exist at Кс/соц —* oo, whereas the conditions for the SPPP existence at £2 v < V/ are similar to those for the SPPPs of type 2. However, in the range from V741 < v < v ", the SPPPs of ty|>e 1 appear. It should be noted that the low-frequency vs~(K) for SPPPs begin at v > 0, when %Г > 1. The increase of free carrier concentration results in the shift of the onset of vs(AT) from 0.54 to 9.5 cm-1 (Melnichuk, 1998; Melnichuk et al., 1994, 1998; Venger et al., 2001).
Thus, in this section, the SPPPs of types 1 and 2 in anisotropic ZnO crystals with different carrier concentration were shown for various orientations of the wave vector toward the crystal surface and optical C-axis. The experimental observation of the SPPPs of type 2 is shown. Besides, new dispersion curves for polaritons of type 3 were presented. These excitations appear in the crystals with electron concentration higher than nQ - 2 x l()ls cm'3 and the orientation K±C and xy±C. The conditions for the existence of the SPPPs of type 3 are shown along with corresponding calculated dispersion curves and ATR spectrum.

