ELECTRICAL PROPERTIES OF UNDOPED ZnO FILMS
The origin of electron concentration in nominally undoped ZnO is still under debate. Although the wide energy gap (3.37 eV at RT) suggests its very low intrinsic value (at the level of n ~ 106 cm-3), the experimentally obtained electron concentration exceeds the intrinsic level by more than ten orders of magnitude. The measured n value depends not only on the growth method, but on applied parameters as well and it varies between 1016 and Ю20 cm-3 (Beh et al., 2017; Krajewski, Luka, Wachnicki et al., 2011, 2014 and references therein). The lower n, at the level of 1014 cm-3, is only reported for single zinc oxide crystals grown by the hydrothermal method where group I elements are incorporated as unintentional dopants, likely contributing to a selfcompensation effect (Jiang et al., 2012; Maeda, Sato, Niikura, & Fukuda, 2005).
The source of high level of electron doping in nominally undoped ZnO is widely investigated for last few decades. Initially, it has been assigned to native point defects, but density functional theory (DFT) calculations show that they are either deep, as oxygen vacancy, or have high formation energy, as zinc interstitial or ZnG (Janotti & van de Walle, 2009 and references herein). For this fact, the native point defects alone cannot provide a large number of carriers justifying high conductivity at room temperature. Hydrogen, which is unintentional contaminant in most of the growth processes, has been commonly considered as a dominant donor in zinc oxide (Kolb & Laudise, 1965 and references therein). However, investigations reported in the last few years show that the role of hydrogen in zinc oxide is not straightforward, as the hydrogen content and electron concentration are rarely consistent, and in some cases amount of hydrogen exceeds considerably the free electron concentration. It has been found that the H2 molecule can be trapped in the oxygen vacancy forming an electrically inactive complex (Du & Biswas, 2011; Janotti & van de Walle, 2007; Shi, Sabotakin. & Stavola, 2004). On the other hand, theoretical calculations performed in the last few years give an evidence that hydrogen can form a variety of complexes involving zinc vacancy, that can be created during the growth process and post-grown annealing (Shimizu et al., 2018). Hybrid DFT calculations show (Frodason, Johansen, Bjorheim, Svenson, & Alkauskas, 2018) that such complexes are highly stable and can involve a few atoms of residual hydrogen VZnnH, because their formation energy is lower than individual constituents. The appearance of such vacancy clusters has been experimentally evidenced (Shimizu et al., 2018). Importantly, theoretical calculation points out that such complexes can have an impact on the optical and electrical properties of zinc oxide.
Electrical Properties of ZnO Grown by ALD
Taking into account the recent theoretical and experimental studies, as well as the results of the previous theoretical density functional calculation on formation energies of native point defects under oxygen- and zinc-rich conditions (Janotti and van de Walle, 2007; Janotti and van de Walle, 2009), it can be expected that growth conditions might have key implications for ZnO electrical conductivity. In this context, electrical conductivity and electron concentration of undoped ZnO performed by ALD. which may differ a few orders of magnitude depending on growth conditions, are of great interest.
In case of polycrystalline ZnO layers grown by ALD within the ALD window, the measured electron concentration n varies between ~10l6 and ~ 1019 cm-3 when Tg changes from 100 to 200°C. It means that n strongly depends on Tg, even though for a deposition process performed in the ALD window the chemical reactions at the surface are chemically well balanced, and the same growth rate ensures conformal coverage of a substrate.
Free electron concentration depends also on other ALD parameters such as pulsing and purging times, but these dependences are much weaker. Moreover, electron concentration versus growth temperature dependence is stronger for thinner films (see Figure 8.10).
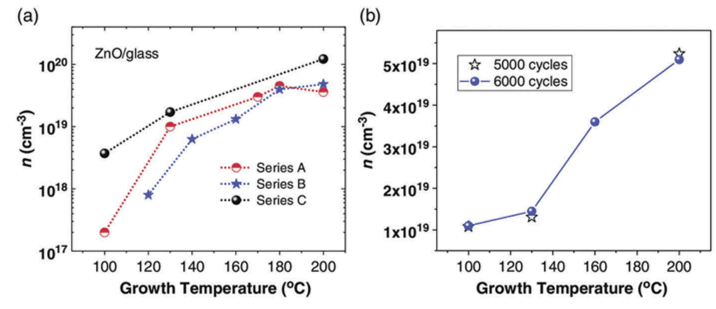
FIGURE 8.10 (a) Electron concentration versus growth temperature for ZnO-ALD films grown with 1000 cycles; series A, B. and C were obtained with different pulsing and purging times; (b) Electron concentration versus growth temperature for ZnO-ALD films obtained with 5000 and 6000 cycles (Guziewicz et al., 2019, reproduced with permission).
In case of ZnO-ALD with thickness less than 400 nm, the carrier concentration can differ up to three orders of magnitude as a result of Tg increase (Figure 8.10a), while for layers ~ 1 pm thick this dependence is less significant and stay at the same order of magnitude (Figure 8.10b) (Krajewski. Luka, et al., 2010, Krajewski, Luka, Wachnicki et al., 2011; Przezdziecka et al., 2009).
Concerning, in turn, the free electron mobility, ц value increases significantly when Tg changes from 100 to 200°C (Krajewski, Luka, Wachnicki et al., 2011b; Przezdziecka et al., under consideration). The mobility value of polycrystalline films also depends on the thickness of ZnO layer. For ~ 100 nm thick layers deposited at 100°C, mobility is at the level of 1-5 cnr V-1 s" while for ~400 nm thick or thicker films, mobility exceeds 30 cm2 V-1 s_l.
Impurities
In the ALD processes, hydrogen and carbon impurities can be expected, because the used precursors contain hydrocarbon and hydroxyl chemical groups. The Secondary Ion Mass Spectroscopy (SIMS) and X-ray Photoemission Spectroscopy (XPS) measurements show that carbon contamination varies between 1 and 2%, and it is lower in ZnO samples deposited at higher temperature (Guziewicz et al., 2012). Therefore, it is unlikely that carbon is a reason for observed conductivity deference between films deposited at different temperatures. Hydrogen concentration, as measured by SIMS, reveals an unexpected dependence on growth temperature. Hydrogen is commonly regarded as electron dopant in ZnO. However, in ZnO-ALD films hydrogen concentration is higher in films deposited at 100°C, where electron concentration takes the values much lower than in films grown at 200°C (Guziewicz et al., 2012; Krajewski, Dybko, et al., 2014, Krajewski, Guziewicz, et al., 2009). Such a dependence between hydrogen content and electrical conductivity has been reported by many groups for polycrystalline ZnO-ALD films deposited at low temperature regime (Beh et al., 2017; Huang, Ye, Sun. Kiang, & de Groot, 2017; Thomas & Cui, 2012).
The high hydrogen content accompanying low carrier concentration can be understood in terms of complexes involving hydrogen and native point defects. It must be taken into account that the high hydrogen content is accompanied by oxygen-rich conditions and the associated low formation energy of zinc vacancy. For this reason, it can be expected that the complexes involving hydrogen and zinc vacancies are easily created. As theoretical calculations show, such complexes, VZn «H. have an influence on the ZnO conductivity (Shimizu et al., 2018). This problem will be more thoroughly discussed in the next section.
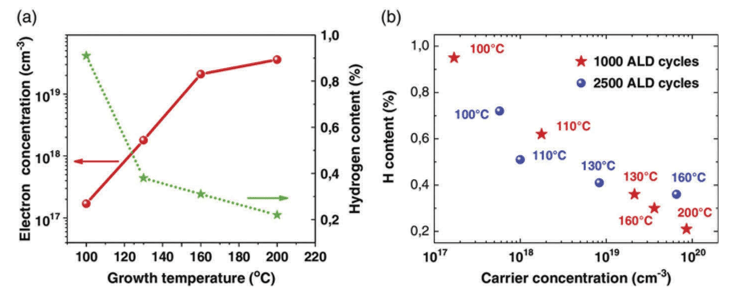
FIGURE 8.11 Electron concentration and hydrogen content for a series of ZnO films grown at temperature range between 100 and 200°C (Guziewicz et al., 2019, reproduced with permission).
STOICHIOMETRY
The results of stoichiometry measurements of ZnO-ALD films shed some light onto the origin of the large conductivity difference. These kind of investigations are much more difficult than measurements of impurity concentration, because of the possibility of systematic errors; therefore, they ought to be performed on a series of ZnO samples prepared under exactly the same experimental conditions. The stoichiometry studies of ZnO-ALD films were performed both by RBS and XPS and led to the same conclusion. They show that the 0:Zn ratio decreases with deposition temperature, that is, the oxygen content in ZnO films obtained at 10O°C is higher than in films obtained at higher temperature (Guziewicz et al., 2012; Ratajczak et al., 2013).
The above finding points at different growth conditions as the origin of observed conductivity difference. When growth temperature approaches 100°C, the conditions are more oxygen-rich while more zinc-rich conditions are achieved for 200°C. As shown by DFT calculations (Janotti and van de Walle, 2007; Janotti and van de Walle, 2009), the formation energy of native point defects is quite different under oxygen-rich and zinc-rich conditions. In the former case, the formation energy of such defects as zinc vacancy, VZll, or oxygen interstitial, O,, is lower, while under zinc-rich conditions, zinc interstitial. Zn;, or oxygen vacancy, Vo, can be easily created.
OPTICAL PROPERTIES
Optical studies provide valuable information on deep and shallow defect levels. The knowledge of shallow defect states that can be thermalized at room temperature, thus providing carriers participating in electrical conductivity, is particularly valuable.
It is well established that growth temperature, which determines oxygen- and zinc-rich conditions, considerably influence the energy of defect-related photoluminescence (PL) bands of ZnO-ALD films situated between 1.9 and 2.4 eV. The resistive ZnO samples obtained at temperature 100-125°C show a broad PL band at ~1.9 eV, which is ascribed to the acceptor-like zinc vacancy defect. In turn, the conductive ZnO samples obtained at 175-225°C show a defect PL at ~2.4 eV, which is assigned to the donor-like oxygen vacancy (Beh, Hiller, & Salava, et al., 2018; Beh. Hiller, & Zachariars, 2018; Krajewski et al., 2017). The post-growth annealing experiments, showing a variation of the defect PL band depending on the annealing atmosphere, support the above assignments (Beh, Hiller, Salava et al., 2018). However, deep defect-related PL bands were reported for ZnO-ALD layers with thickness 30-200 nm, while for samples thicker than 500-700 nm, only a band-edge PL is visible (see Figure 8.13) (Przezd- ziecka et al., 2020; Przezdziecka, Guziewicz, & Witkowski, 2018).
The recently performed study of the temperature-dependent PL on a series of samples obtained at different Tg was carried out in order to address the question whether oxygen-rich and zinc-rich growth conditions affect shallow states (Przezdziecka et al., 2020). It has been established that band-edge low temperature PL spectra of films deposited at 100, 130, 160 and 200°C are considerably different pointing at different binding energies and a different number of donor-related bands. PL spectra of these films taken after a short post-grown rapid thermal processing (RTP) in oxygen atmosphere (3 min at 800°C) show narrow PL features appropriate for a detailed analysis of temperature dependence.
A short annealing process does not only improve the crystal quality of the ZnO-ALD films, but also opens the optical band gap. Transmission measurement and ellipsometric studies show that Eg in annealed samples is about 30 meV wider than in as-grown ones (Figure 8.14). This effect has been assigned to the removal of some defect states from the band gap. However, it should be noticed that even after RTP annealing, the optical band gap depends on the previously applied growth temperature, and for samples deposited at 200°C the band

FIGURE 8.12 (Left) The Ols and Zn2p core level spectra measured for a series of polycrystalline ZnO films grown at 100°C (bottom), 150°C (middle), and 300°C (top); (right) the 0:Zn atomic concentration ratio in ZnO-ALD films grown at temperatures 100-300°C as derived from high-resolution XPS measurements. The 0:Zn values are normalized to the 0:Zn value (0.716) found on the commercial ZnO crystal (MaTecK™) (Guziewicz et al., 2012, reprint with permission).
gap is about 20 meV wider than in that grown at 1()0°C (see Figure 8.8). Both for the series of as-grown and annealed samples £g scales with n2/i, where n is electron concentration, so the last phenomenon has been assigned to the Burstein-Moss effect (Guziewicz et al., 2019).
The band-edge PL spectra of the annealed polycrystalline ZnO films depend on their growth temperature (see Figure 8.14). For samples deposited at 100 and 130°C, two donors can be distinguished, w'hile for samples deposited at 160 and 200°C, only one is clearly

FIGURE 8.13 Low-temperature PL in a wide spectra range of ~800 nm thick ZnO-ALD samples, as grown and annealed, obtained at 130°C (Guziewicz et al., 2019. reprint with permission).

FIGURE 8.14 Tauc plot for the ALD-ZnO films deposited at different (indicated) temperatures. The absorption coefficient a is taken from ellipsometry measurements (Guziewicz et al., 2019, with permission).
visible. Moreover, the intensity ratio of acceptor-related PL band, situated between 3.30 and 3.32 eV, and donor-related PL band, situated very close to the band edge, changes a lot for the films deposited at different Te (Figure 8.15) (Przezdziecka et al.. 2020). This suggests a higher number of acceptor-related states in ZnO films deposited at low' temperature i.e., w'hen growth conditions are oxygen-rich. The predominance of acceptor-related PL over the donor-related PL is the most pronounced for the ZnO film grown at 100°C.

FIGURE 8.15 The band-edge PL spectra of ~800 nm thick ZnO-ALD films deposited at 100, 130, 160 and 200°C and post-grown annealed in oxygen for 3 min at 800°C (Guziewicz et al., 2019).
It has been found that donor binding energies, calculated based on donor localization energies and the Haynes’ rule, vary from 49 to 58 eV and are different for samples deposited at different Tg. Acceptor binding energy is similar for deposition temperature up to 160°C and then equals 127 meV, while it is slightly lower (123-125 meV) when growth temperature rises to 200°C. However, probably the most pronounced difference was found in the relative intensities of acceptor- to donor-related states, which is much higher for low deposition temperature. This suggests that the number of shallow acceptors versus the number of shallow donors increases when growth conditions are moved toward oxygen-rich condition.
From the results presented above, it is evident that the polycrystalline ZnO films deposited at 100°C, which in ALD means oxygen-rich conditions, are more resistive and contain significantly more acceptor states versus donor states as compared to films grown at temperature 160°C and higher, where conditions are moved towards zinc-rich. The question arises whether the quality of these films, which are grown at temperature much below that required for epitaxial growth, is suitable for their use in electronics. In the last part of the chapter, we will attempt to address this question showing the optical decay dynamics measurements, ability to achieve the /?-type conduction, and an electrical junction based on ZnO obtained at low temperature limits.
Interesting insight into the quality of ZnO-ALD films grown between 100 and 200°C provides time-resolved photoluminescence measurements (Guziewicz et al., 2019). Time-resolved PL measurements were performed to compare the optical decay dynamics and to reveal the lifetimes of ZnO-ALD films obtained at 100, 130 and 200°C. ZnO samples were grown with 2500 ALD cycles, which resulted with a thickness of about 400 nm. The time-resolved PL spectra were measured with a streak camera at temperature of 4 К using the 300 nm laser line with 100 pW average power.
The PL decays of the 3.36 eV excitonic peak of as-grown and RTP-annealed ZnO-ALD films are shown in Figure 8.16. The luminescence decay times are short and for the as-grown samples they range between 70 and 168 ps (dot lines in Figure 8.16). More than twice

FIGURE 8.16 Time-resolved PL spectra of ~400 nm thick ZnO-ALD films measured near to the band edge (3.35 eV). The experiment was performed at 4 К with 300 nm laser line (laser power 100 gW). (Guziewicz et al., 2019, reproduced with permission).
longer decay times are observed for samples deposited at 100 and 130°C (150 and 168 ps, respectively) than for the sample deposited at 200°C (70 ps). After RTP annealing, all the PL spectra are much sharper and the PL decays are closer to be exponential (solid lines in Figure 8.10). Moreover, in case of samples deposited at 100 and 130°C, the intensity of the PL band at 3.36 eV increases more than three times after the RTP annealing process. The PL decay times after annealing are shorter, but the samples grown at lower temperature reveal much longer decay times (100 and 134 ps) than the sample grown at 200°C (only 24 ps), similarly as it was for the as-grown samples. It should be mentioned that the decay times of the samples deposited at 100 and 130°C are comparable to the decay time of the 3.36 eV PL of the reference commercial single crystalline ZnO (from MaTeck), which was determined as 160 ps.
From the results presented above, it is evident that the samples grown at the temperature range 100-130°C reveal better optical characteristics than the polycrystalline ZnO films obtained at much higher temperature (200°C) and, at some points, comparable with crystalline zinc oxide. This phenomenon might be understood in terms of growth conditions, which are changed from oxygen-rich toward zinc-rich when deposition temperature is increased.

