Wide and Ultrawide Bandgap Oxides for Photovoltaics and Photonics
Larysa Khomenkova
INTRODUCTION
Oxide-based materials and structures are becoming increasingly important in a wide range of practical fields including microelectronics, photonics, optoelectronics and magnetoelectronics, spintronics, thermoelectrics, power harvesting, and energy storage as well as for environmental application. Synthesis, fabrication, and processing of these materials, as well as transformation into particular device structures are still a challenge. Among different oxides, Zr02, HfC)2, La203, Y203, Al203, and the silicates ZrSi04 and HfSi04 are often considered as high-к dielectrics, being used for microelectronic devices as an alternative to Si02 gate materials (He, & Sun, 2012; Houssa, 2003; Kingon,Maria, & Streiffer, 2000; Robertson, 2002; Wilket al., 2001). This is because the Si02 layer thinner than 2 nm no longer acts as a good insulator due to direct tunneling current across. However, the replacement of Si02 with a thicker high-к layer, with the same equivalent capacitance or “equivalence oxide thickness,” has also certain other conditions, including chemical stability in direct contact with Si substrate. This rules out both Ti and Та oxides, which both react with Si to form silicide phase. Another key factor is to serve as the barriers for both electrons and holes. It requires that both their valence and conduction band offsets be over 1 eV. These two conditions allow the most effective oxides to be identified, considering the parameters summarized in Table 9.1 and Figure. 9.1. However, these materials have unique optical properties that give a hand to their application in solar cells, light-emitting devices, and catalysis, along with their wide microelectronic application.
Silicon oxide, Si02, is a covalent random network in which Si is four-fold bonded to oxygen and О is two-fold bonded to Si. Its bandgap is 9 eV (Table 9.1). Its valence band maximum consists of nonbonding oxygen /г-states with a large effective mass. The conduction band minimum is a broad minimum of Si 3.v-states with an effective mass of about 0.5. The ionicity of each Si-O bond is about 50%. Contrary to this, all high-к oxides are largely ionic (Lucovsky, 2001).
Aluminum oxide (A1203) is the only s-p bonded oxide with к - 9-11. It can be found in different forms (Figure 9.3) that can be both amorphous and crystalline. The Al coordination is mainly six-fold and some four-fold. Crystalline A1203 has a number of polymorphs. Sapphire (a-Al203) is hexagonal with six-fold Al. y-Al203 is a cubic spinel structure, in which Al is both four- and six-fold coordinated, that also contains hydrogen (Busca, 2014; Houssa, 2003). The bandgap is 8.8 eV and direct. The conduction band shows a broad minimum at Г point of Al 3.s-states. The upper valence bands are nonbonding oxygen /^-states. The overall valence band is 7 eV wide. There is a considerable charge transfer between Al and О states, and the valence band is mainly oxygen-like. This charge transfer is larger than that in Si02.
TABLE 9.1
Parameters of different oxides
|
Material |
Gap (eV) |
Electron affinity (eV) |
Static dielectric constant, (or k) |
Charge neutrality level of the interface states (eV) |
High- frequency dielectric constant f;„ |
Schottky pinning parameter S |
CB offset with Si (eV) |
Thermal stability, Tmax (°C) |
|
SiO, |
9 |
0.9 |
3.9 |
4.0 |
2.25 |
0.86 |
3.5 |
>1420 |
|
ZrO, |
5.8 |
2.5 |
|
3.6 |
4.8 |
0.41 |
1.4 |
-900 |
|
HfCb |
4.5-6 |
2.5 |
|
3.7 |
4 |
0.53 |
1.5 |
-430-600 |
|
Ab03 |
8.8 |
1 |
9 |
5.5 |
3.4 |
0.63 |
2.8 |
-1000 |
|
ZrSi()4 |
6.5 |
2.4 |
10-12 |
3.6 |
3.8 |
0.56 |
1.5 |
>1700 |
|
HfSi04 |
~6 |
2.4 |
10-11 |
3.6 |
3.8 |
0.55 |
1.5 |
>1700 |
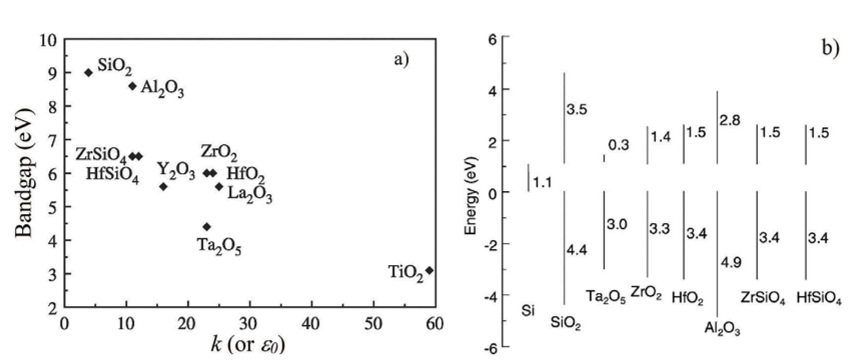
FIGURE 9.1 Variation of dielectric constant with bandgap of different oxides (a) and their corresponding band offsets on Si (b).
Adopted from (Robcrston, 2002).
Among alternative to SiO, gate oxide, the simplest from the group 1VA is zirconium oxide (Zr02). Zr02 is stable in the monoclinic structure at room temperature, it transforms to the tetragonal structure above 1170°C and to cubic one at 2200°C, but can be stabilized in both these phases at room temperature via doping with Si, Ge, or Y (Khomenkova, & Korsunska. 2019; Korsunska, & Khomenkova, 2019). In cubic Zr02, Zr and О have, respectively, eight О and four Zr neighbors. In monoclinic or tetragonal Zr02, each Zr atom has seven oxygen neighbors. This oxide has an indirect gap of 5.8-6.5 eV. The valence band is 6 eV wide, and it

FIGURE 9.2 Schematics of the main solid-state transformations of aluminas. Reprinted with permission from (Busca, 2014). Copyright 2014 Elsevier.

FIGURE 9.3 Band structure of АЬОз, Zr02, and Hf02. Adopted from (Houssa, 2003).
has a maximum at X formed from oxygen /7-states. The conduction band minimum is а Г12 state of Zr 4r/-orbitals. A considerable charge transfer from Zr to О occurs. The valence band is strongly О /7-states and the conduction band- Zr Hafnium oxide (НЮ2) is structurally and electronically similar to Zr02. It has similar bandgap, except that the crystal splitting of the Hf 5r/-states in the conduction band is larger. Lowering the crystal symmetry of both Zr02 and НЮ2 results in the narrowing of their bandgaps as well as slight broadening of the valence states and intermixing of the xZ-states in the conduction band, and, in consequence, there is no longer a simple crystal field gap (Houssa, 2003). In this chapter, some recent applications of these oxides (both undoped and doped with different impurities) are considered. Amorphous А12Оз is an attractive material not only for microelectronics, but also for integrated photonics. It provides active and passive functionalities, especially, when doped with rare-earth (RE) ions. In contrast to Si, Si02 and Si3N4 that have a low solubility for RE ions (Kik, & Polman, 1998; Xing et al., 2017), amorphous АЬ03 can host high concentrations of RE ions with moderate quenching of luminescence (Agazzi et al., 2013; Vazquez- Cordova et al., 2014). The ability to host high concentrations of RE ions in combination with the wide transparency window (150-7000 nm) and low propagation loss (Demirtaset al., 2018; Worhoff et al., 2009) makes amorphous A1203 an attractive material for UV, visible, near-, and mid-IR on-chip active devices (Ishizaka, & Kurokawa, 2000; Purnawirman et al., 2017; Yang et al., 2010). Many different lasers and amplifiers have been demonstrated in the last few years using amorphous RE ion-doped АЬОз as gain material as well as RE ion-doped АЬОз in combination with passive photonic platforms, such as Si3N4 (Agazzi et al., 2013; Vazquez- Cordova et al., 2014). The realization of the active devices in a fully doped АЬОз layer has two main limitations, namely a restriction in the dopant concentration that can be used and lack of integration with other optical functions on the chip due to introduction of losses via misalignment. Recently, a single-layer monolithic integration scheme was proposed to integrate active and passive regions on a wafer by using a photonics damascene method. Using this approach, only one lithography and etching step was required to fabricate all functionalities, leading to self-aligned transitions from the passive to the active sections. Since the difference of refractive index between doped and undoped Ab03 is minimal, very low transition losses were obtained. Furthermore, the low loss of the undoped АЬОз waveguide will permit the realization of complex integrated photonic devices. Figure 9.4 shows ring resonators with an input-output bus waveguide. The active material is Yb3+:Ab03 and the device was pumped at 976 nm to excite the Yb3+ ions in the doped region. The luminescence in the active region was taken with a standard photo camera through a microscope objective such that the rings of a couple of tens of micrometers are clearly visible (Figure 9.4). The luminescence in the visible regime is due to Er3+ or Tm3+ impurities in the active region. At the top of the ring a weaker, tilted, straight line is visible. This is caused by stray light from the in-coupling light, which luminesces in the active region. The dopant concentration utilized was too low, which, in combination with the relatively low FIGURE 9.4 Photograph of (a) chip containing rings with a radius of 100 and 150 pm, showing the luminescence of the ytterbium-doped active region in the center ring, (b) Same photograph without background light. Luminescent stray light can be observed on the top of the ring. Reproduced from van Emmcrik et al. (2018), Copyright 2018 Optical Society of America under the terms of the OSA Open Access Publishing Agreement. overlap with the pump (i.e., 290 nm thick doped layer in a 400 nm total thickness of АЬОз, comparable with 43% of the power in the fundamental mode overlapping the active region) prevented lasing from the device. Since the fabrication is realized in a single lithography and etching step, no misalignment in that region occurs, further increasing the efficiency of the transition. Toward the center of the active region, the fraction of doped layer slightly increases and therefore the luminescence becomes stronger (van Emmerik et al., 2018). Figure 9.5 demonstrates another example of the application of АЬОз doped with Er ions (Vazquez-Cordova et al., 2014). The waveguide cross-section consisted of a 1-pm-thick by 1.5-pm-wide АЬОз:Ег3+ channel with ridge height of 0.35 pm. This geometry allows high FIGURE 9.5 (a) Waveguide amplifier cross-section and simulated signal-mode profile, (b) Photograph of a pumped (Ap = 976nm) АЬОз:Ег,+ spiral amplifier on a silicon chip. A close-up view of the spiral amplifier is shown in the inset, (c) Infrared image (A = 1320 nm) of a quarter of a spiral-shaped channel waveguide. (d) Intensity distribution along the propagation direction in the spiral-shaped channel waveguide. Reproduced from Vazquez-Cordova et al. (2014), Copyright 2014 Optical Society of America under the terms of the OSA Open Access Publishing Agreement. confinement in straight and bent sections of the waveguide. Moreover, higher signal and pump intensities were achieved in comparison with the channel geometry presented by Bradley et al. (2010). The simulated pump and signal mode fields had an overlap of ~95% and ~85% with the doped region, respectively. The refractive indices employed in the simulations were taken from previous measurements. The waveguide cross-section and the mode-field distribution at the signal wavelength of 1532 nrn are displayed in Figure 9.5a. Understanding the performance of an Er3+-doped amplifier is significantly complicated by the spectroscopic processes of the Er3+ ion. The migration-accelerated energy transfer upconversion process (4/u/2 4Лз/2) —* (4^i5/2>%/2) induces a concentration- and excitation- dependent quenching of the 4Ib/2 amplifier level. More importantly, a fast quenching process of this level limits the optimum Er3+ concentration in АЬОз to (1 - 2)x 1020cm-3. As a consequence, waveguide lengths on the order of 10 cm are desired for efficient amplifier performance. Figure 9.5b demonstrates a fabricated spiral-shaped channel waveguide with a minimum bending radius of R = 2 mm. For this radius, the simulated additional bending loss of <10-6 dB/cm is negligible compared to the straight-waveguide propagation loss of ~0.1 dB/cm and the mode-mismatch loss of ~0.02 dB at the junction in the center of the spiral (Figure 9.5c, d). Transverse-electric polarization was chosen for signal and pump light in the simulations and measurements. This finding showed the perspectives for the integration of RE-doped A1203 with Si-based technology for optical communication devices. FIGURE 9.6 (a) The schematic for the luminescent devices based on the nanolaminate AbCf/TnbO, films, (b) The EL spectrum from the device in which the АЬОз/ТпъОз subcycle ratio is 13:2 (AOT-2), the inset shows the radiative transitions in the Tm3+ ions resulting in the EL emissions, (c) The images taken by a digital camera from this AOT-2 MOS-structured light-emitting device (MOSLED) at different injection currents. Reproduced from Liu ct al. (2019). Copyright by 2019 by the authors. Licensee MDPI, Basel, Switzerland. This article is an open access article distributed under the terms and conditions of the Creative Commons Attribution (CC BY) license. Aiming for the realization of compact Si-based optoelectronics, electroluminescence (EL) from RE ions has been extensively reported in many compounds, such as SiN.v, ТЮ2, and ZnO. However, the efficiencies of the devices based on the aforementioned materials are far from practical utilization. One of the limitations is the large leakage current. RE-implanted Si02 or SiONv structures have attracted much attention due to their notable EL efficiency and silicon compatibility (Cueff et al., 2011; Jambois et ah. 2009; Rebohle et ah, 2014; Sun et ah, 2006). However, the mismatch in the coordination structure and atomic size of silicon (tetrahedron) and RE ions (octahedron) is another limit that provokes the clustering of RE ions in the Si-based host. In comparison, similar devices based on A1203 nanofilms present much lower working voltage, and comparable efficiency while their EL performance needs more exploration (Liu et ah, 2019; Yang, Li, & Sun, 2018). Blue emission, which has the highest photon energy (2.6-2.7 eV) of the three primary colors, is of great importance in display and lighting. Tm3+ ions have presented efficient blue emissions in various matrixes. Recently, Liu et ah (2019) reported on the EL properties of Tm3+-doped A1203 thin films grown by atomic layer deposition. Using Tm-doped A1203 might exploit the merits of both oxides to realize efficient blue EL from Tm3+ ions. Figure 9.6 shows the schematic for the multilayered devices and EL spectrum from the MOSLED based on the Al203/Tm203 nanolaminate. The EL emissions mainly exhibit several peaks at the wavelengths of 368, 456, 474, and 802 nm, which originate from the radiative transitions from the 'D2, 3F4, ^4, and 3H4 excited states to the 3H6 ground state in Tm3+ ions, respectively (Figure.9.6b). It is noteworthy that the EL emissions at 456 and 474 nm are dominating and the blue light is easily seen by naked eyes (Figure.9.6c). It was observed that the emission at 456 nm from Tm3+ ions exhibits a power density of 0.15 mW/cnr. However, some decrease of the EL intensity and decay lifetime was observed in the samples governed by the clustering and cross-relaxation of the Tm3+ ions in the films with high Tm content (Liu et al., 2019). The decay lifetime for the Tm3+ ions under optical excitation is in the range of 0.13-1.25 ps while under electrical excitation, the decay lifetime increases to 1.13^4.02 ps. The EL is attributed to the impact excitation of the Tm3+ ions by hot electrons in the A1203 matrix. These results supported the development of Si-compatible RE-doped light sources by modifying the dopant structure in the nanolaminates to achieve efficient emissions. FIGURE 9.7 Schematic presentation of energy levels of different oxygen vacancies in Zr02 (Hf02)-based materials.AL20;j-BASED MATERIALS DOPED WITH RARE-EARTH IONS
Yb-Doped Al203

Er-Doped Al203


Tm-Doped Al20:5 Materials


