EFFECT OF STRONG MAGNETIC FIELD ON SURFACE POLARITONS IN ZNO
It is known that when a semiconductor is situated in a magnetic field, a number of effects can appear, in particular, the Zeeman effect, diamagnetic shifting and transitions between the Landau levels, etc. (see, for instance, Haider, 2017; Landau & Lifhsitz, 1984; Sizov & Ukhanov, 1979; Sugano & Kojirna, 2000; Zvezdin & Kotov, 1997). A comprehensive analysis of the latter was made for CdSe crystals by Kapustina, Petrov, Rodina, and Seisyan (2000). The spectral curves in a cubic magnetic semiconductor, the Cotton-Mouton effect quadratic in a magnetic field (the Voigt effect), nonreciprocal birefringence linear in a magnetic field, and the Faraday Effect were investigated by Krichevtsov and Weber (2004). It was shown that the Voigt effect is anisotropic in cubic magnetic semiconductors.
The propagation of electromagnetic waves in uniaxial semiconductors subjected to a magnetic field that is not parallel to the crystal axis was considered at first by Gurevich and Tarkhanyan (1975). It was shown, in particular, that the effect of cyclotron and plasma resonance shifting is related to their transformation to the combined cyclotron-plasma resonances. The Faraday Effect in cubic and hexagonal crystals was considered by Gurevich and Ipatova (1959); however, no comprehensive analyses of the expressions for the Faraday rotation were reported. Until end of the last century, the investigations of the effect of magnetic field on the specular IRR in uniaxial optically anisotropic single crystals were not addressed at all.
As it was mentioned in previous section, there are number of works devoted to the phonon and plasmon-phonon polaritons in polar optically isotropic and anisotropic semiconductors (Agranovich & Mills, 1985; Dmitruk et al., 1989; Venger, levtushenko, Melnichuk, & Melnichuk, 2008, 2010; Venger et ah, 2001). In the previous section, it was shown that in the range of “residual rays” of semiconductor, the excitation of surface polaritons of the phonon type (i.e., SPP) and plasmon-phonon type (SPPP) is possible. Hereafter, the effect of magnetic field on the SPPs and SPPPs will be discussed.
One of the first papers on the effect of magnetic field on different excitations has appeared in 1973, when Brion et al. reported on the properties of surface magneto- plasmons in polar semiconductors under magnetic field of 100 kOe (see Brion. Wallis, Hart- stein, & Burstein, 1973). Later, Palik et al. (1976) showed the formation of surface mag- neto-plasmons in InSb crystals (Palik et ah, 1976). However, the first consideration of the effect of magnetic field on optically anisotropic crystals was performed by the authors of this chapter, especially for ZnO materials. Some main results will be presented below, that is, the effect of high uniform magnetic field on the surface phonon and plasmon-phonon polaritons will be discussed for ZnO crystals. The orientation was C||_y, K±C, xyC, H±K,Hy,Kx = K, Ky, = 0 Hy, Kx — K, Ky,z = 0 (Figure 7.8).
7.3.1 Theoretical Consideration of the Effect of Magnetic Field on the Surface Polaritons in ZnO
Let us consider a polar optically anisotropic ZnO single crystal in which the excitation and propagation of different types of surface polaritons occur along the crystal surface as shown in Figure 7.8. The л-axis is parallel to the direction of electromagnetic wave propagation at Cy.
The calculation of the reflection coefficient R - ///0. where Iq is the intensity of incident infrared light at a given frequency and I is the intensity of reflected light at the same

FIGURE 7.8 ZnO crystal structure and the configuration of vectors H and K, C-axis and ,v-, y-, and z-axes in the crystal frequency, was performed taking into account an additive contribution of the phonon and plasmon subsystems in dielectric function of the semiconductor as well as the effect of magnetic field (Venger et al., 2001, 2010). The components of the dielectric constant in the magnetic field were considered as:

where Qc = ^ is the cyclotron frequency; ек±,ц - is high-frequency dielectric constant; vhji, V7-±n are respectively the frequencies of the longitudinal and transverse optical phonons; v/)X.|| is plasma resonance frequency; ypi_t is plasmon attenuation factor; and уухц is the damping coefficient of optical phonon.
The calculation was performed for the different ZnO crystals (Table 7.1) using self-consistent parameters of ZnO presented in Table 7.2. The obtained results are collected in Table 7.3.
7.3.2 Surface Polaritons in ZnO under Macnetic Field (Experimental Results)
Figure 7.9 (symbols) shows experimental ATR spectra of ZnO crystals with щ = 9.3 x Ю16 cm'3 (Figure 7.9a), n0 - 6.6 x Ю17 cm-3 (Figure 7.9b), and n0 = 2.0 x 101S cm'3 (Figure 7.9c). The spectra were recorded at different air gaps (d - 3.4- 14.6 pm) and ATR prism angles (a - 30°, 35°, and 50°). The air gap between the ATR prism and the sample was varied until the absorbed wave intensity was reached about 20 % of minimum intensity of ATR spectrum.
The simulation of ATR spectra was performed according to the approach described by Venger et al. (2001) in the absence (solid curves 1-3) and the presence of magnetic field of H = 100 kOe (dashed curves l'-3'). It was observed that the magnetic field caused the shift of the ATR minima toward higher frequencies. This shift is more pronounced for ZnO with higher carrier concentration (Figure 7.9a, b). Indeed, the minima for the sample with n0 - 9.3 x 1016 cm-3 were observed at vmj„ = 518 (1), 537 (2), 551 (3) cm'1 (without the magnetic field)
TABLE 7.3
The parameters of ZnO crystals with different carrier concentrations extracted by the comparison of experimental and theoretical values of R(v)
|
Sample |

|

|

|

|

|

|
||||

|

|

|

|

|

|

|

|
|||
|
Z02-3 |
9.3 x Ю'6 |
90 |
100 |
150 |
170 |
11 |
11 |
2.9 |
2.9 |
0.88 |
|
ZOl-3 |
6.6 x Ю'7 |
240 |
250 |
280 |
260 |
13 |
13 |
3.0 |
3.6 |
1.08 |
|
Z06-B |
2.0 x 10,S |
420 |
480 |
406 |
350 |
21 |
21 |
3.1 |
3.2 |
1.16 |
|
ZC1M |
4.2 x 10IS |
605 |
— |
1020 |
— |
14 |
— |
2.0 |
— |
— |
|
Z09 |
5.0 x Ю'9 |
2115 |
— |
1480 |
— |
40 |
— |
1.9 |
— |
— |

FIGURE 7.9 ATR spectra of ZnO crystals versus electron concentration and magnetic field value obtained for the samples: Z02-3, h0 = 9.3 x 1016 cm 3 (a, d); ZOl-3, n0 = 6.6 x Ю17 cm 3 (b, e), and Z06-B, n0 = 2.0 x К)18 cm 3 (c, f)- The spectra recorded with the air gap of: (a) d = 14.6 pm (1,1'), 8.7 pm (2,2'), and с/ = 4.1 pm (3,3'); (b) d = 13 pm (1,1'), 7.4 pm (2,2'), and 3.4 pm (3,3'); c) d = 10.2 pm (1,1'), 5.6 pm (2,2'), and 2.6 pm (3,3'); (d, f) d = 4.0 pm (1—4); (e) d = 5.0 pm (1—4). The angle of ATR prism was: for (a-c), a = 30° (1,1'), 35° (2,2'), and 50° (3,3'); for (d) a = 50° (1-4); for (e, f) a = 40° (1-4). Magnetic field was: for (a-c) H = 0 (1-3) and 100 kOe (Г-3'); for (d-f) H = 0 (1), 30 (2), 65 (3), and 100 ЮЕ (4). In all figures, the symbols correspond to experimental data and lines (solid and dashed) are the simulated ATR spectra being shifted to vmj„ = 518 (Г), 538 (2'), 552 (3') cm-1 when magnetic field was applied. The half-width of the spectra was Tp = 2, 3, and 9 cm-1, respectively (Figure 7.9a).
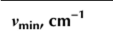
For ZnO crystal with higher electron concentration (n0 - 6.6 x 1017 cm-3), the ATR spectra without magnetic field have the minima at vmin = 527 (1), 550 (2), and 563 (3) cm-1 with the half-width Гр = 5 (1), 17 (2). and 28 (3) cm-1, respectively. When magnetic field was applied, these minima were shifted toward vmin = 528 (F), 551 (2'), and 564 (3') cm-1 accompanied by the broadening of the ATR spectra (Tp = 7 (F), 19 (2'), and 32 (3') cm-1, respectively). Thus, the effect of the magnetic field on the polaritons is significant for the doped samples that are supported by the spectra simulation of the samples with higher electron concentration (Figure 7.9c). Indeed, when n0 - 2.0 x 101S cm-3, the minima were found at vmjn = 557 (F), 574 (2'), and 582 (3') cm-1, whereas the width of ATR spectra was Tp = 58 (F), 92 (2'), and 99 (3') cm"'.The effect of the magnetic field value on ATR spectra was also investigated for the same ZnO crystals. As one can see from Figure 7.9d-f, for the sample with electron concentration n0 - 6.6 x Ю17 cm"3, the increase of magnetic field value up to H - 100 kOe (with constant angle of incident light and the air gap) results mainly in the broadening of ATR spectrum (from Tp = 20 up to 28 cm"1) at nearly constant minimum position (vmin = 558 cm"1). At the same time, for the sample with higher electron concentration (n0 = 2.0 x Ю18 cm"3), the increase of magnetic field causes the shift of the vmin to low-frequency side from vmin = 580 cm"1 down to 578 cm-1 and broaden the ATR spectrum, i.e. Tp increases from 83 cm"1 up to 98 cm”1 (Figure 7.90- However, for the sample with low carrier content (n0 - 9.3 x Ю16 cm"3), the opposite shift of the vmjn was found (from 551 cm"1 to 552 cm"1) accompanied also by the spectrum broadening (Figure 7.9d). For all the samples, the increase of magnetic field value causes the decrease of the R(v) value (Figure 7.9). The results mentioned above are collected in Table 7.4.
Figure 7.10a presents the dispersion curves of ZnO crystals (mentioned in Table 7.4) without magnetic field taking into account the damping coefficients of the phonon and plasmon subsystems. The n0 varied from 9.3 x Ю16 cm"3 (curves 1, F) via 6.6 x Ю17 cm”3 (curves2, 2') up to 2.0 x Ю18 cm"3 (curves 3, 3'). The symbols represent the experimental data. Curves 1-3 correspond to high-frequency dispersion branches with v+(K) - 561 cm”1 (curve 1), 578 cm”1 (curve 2), and 627 cm"1 (curve 3). The low-frequency dispersion branches has cutoff frequency v~(K) = 59 cm"1 (curve F), 152 cm”1 (curve 2'), and 246 cm"1 (curve 3'). The simulation of the dispersion curves was performed according to the approach used by Melnichuk (1998); Melnichuk, Melnichuk, and Pasechnik (1996); Melnichuk et al. (1998); Melnichuk and Pasechnik (1996, 1998). It is seen that the increase in the concentration of free carriers in ZnO crystals is accompanied by a shift in the SPPPs frequency to the high-frequency side. Moreover, whatever the concentration of free carriers, the high-frequency branches of the SPPPs start at v = vTj_ and end at К » cole, asymptotically approaching the cutoff frequency.
TABLE 7.4
Parameters v+, v”, and vf of surface polaritons in ZnO crystals versus magnetic field
|
Sample |
Electron Concentration, n,„ cm"3 |
Magnetic field, H, kOe |
||||||||||
|
0 |
30 |
65 |
100 |
|||||||||

|

|

|

|

|

|

|

|

|

|

|
||
|
Z02-3 |
9.3 x Ю'6 |
59 |
561 |
34 |
108 |
561 |
21 |
171 |
561 |
14 |
242 |
561 |
|
ZOl-3 |
6.6 x Ю17 |
152 |
578 |
124 |
201 |
576 |
98 |
245 |
575 |
80 |
293 |
574 |
|
Z06-B |
2.0 x to'8 |
246 |
627 |
221 |
287 |
620 |
196 |
316 |
612 |
174 |
345 |
607 |

FIGURE 7.10 (a) Dispersion curves ofZnO crystals with electron concentration of 9.3 x 1016 cm 3 (1, Г), 6.6 x 101' cm 3 (2, 2'), and 2.0 x 10l!< cm 3 (3, 3') without (1-3) and with (13') application of magnetic field H = 100 kOe. The experimental data are shown by symbols and modeling is presented by the curves; (b) the modeling of the effect of magnetic field on dispersion curves of sample ZOl-3 (n0 = 6.6 x Ю17 cm 3), H = 0 (1), 30 (2), 65 (3), and 100 (4) kOe; (c) Simulated dispersion dependences for the samples Z02-3 (1), ZOl-3 (2), and Z06-B (3) in the presence of magnetic field H = 100 kOe
Figure 7.1()b shows the variation of dispersion curves of sample ZOl-3 (n0 - 6.6 x Ю17 cm"3) with the increase of the magnitude of uniform magnetic field from H - 0 to 100 kOe. The inset in Figure 7.10b demonstrates negligible variation of high-frequency dispersion curves versus H value, whereas the stronger magnetic field causes the shift of low-frequency dispersion branch toward the lower frequencies. Besides, additional dispersion branch appears in the 190-350 cm-1 spectral range. This branch shifts to high-frequency side for the H values higher than 30 kOe (Figure 7.10b). This is caused by the fact that for stronger magnetic field, the cyclotron frequency Q increases that governs the splitting between plas- rnons and phonons followed by the appearance of a “pure” phonon dispersion branch (Venger et al., 2001). The starting points for the lower and upper dispersion branches correspond to frequencies v = 0 and vx that are the solutions of the equations et = 1 or ei = 0. The asymptotes for the “pure” phonon branch are given by equation 1+£j±/£2 - 0. The cutoff frequencies of pure phonon dispersion branches for ZnO single crystals are collected in Table 7.4. For the samples Z02-3 and Z06-B, the influence of magnetic field on corresponding dispersion relations was found to be similar.
Figure 7.1()c shows the calculated dispersion curves, taking into account the presence of magnetic field with H - 100 kOe, as well as the anisotropy of the phonon and plasma subsystems in their harmonic approximation. It is seen that when concentration of free carriers increases, all three dispersion branches shift to the high-frequency range under magnetic field application. Investigation of evolution of dispersion curves accounting the damping for magnetic plasmons and for surface plasmon-phonon modes in a magnetic field was carried out by Martin. Maradudin, and Wallis (1978) and Shramkova (2004). The authors have observed a backward turn of simulated dispersion curves for the optically isotropic material, taking into account the magneto-plasmon damping. At the same time, for optically anisotropic crystals, such turn was not observed with orientation mentioned above.
Figure 7.11 shows the dependence of the SP damping coefficient on the frequency of rp(v) for ZnO single crystal. The calculation was performed assuming optically smooth crystal surface (Venger et al., 2001). Curves 1-3 are obtained for the samples with different electron concentrations without application of magnetic field. Curves 1-3' are the dependences obtained for sample Z06-B for the case H±K and Hy when H changes from 30 to 100 kOe.
It is interesting that the SP damping coefficient (rsp) can be determined graphically as it is described in Martin et al. (1978); Melnichuk & Pasechnik (1996); Shramkova (2004). Figure 7.12 shows an approach used for determination of the Tsp for optically anisotropic ZnO crystals. Curve 1 is the dispersion branch, and the dashed lines 2 and 3 determine the half-width of ATR spectrum. The “real” half-width of ATR spectrum, according to Reshina, Mirlin. & Banshchikov (1976), is equal to the Tsp and it is determined by the difference of the frequencies corresponded to the intersection of the line perpendicular to the abscissa axis in the system “dashed lines - the dispersion point” (as shown in Figure 7.12). Tables 7.5 and 7.6 collect the

FIGURE 7.11 Spectral dependence of the SP damping coefficient (Г8р) for different ZnO crystals without application of magnetic field: 1 - Z02-3; 2 - ZOl-3; 3 - Z06-B. Curves 1-3' demonstrate the evolution of rsp versus magnetic field for sample Z06-B; H = 30 (1'), 65 (2'), and 100 (3') kOe

FIGURE 7.12 Dispersion curves for sample ZOl-3 (n0 = 6.6 x 1017 cm 3). Гр is the half-width of ATR spectrum and Fsp is the SP damping coefficient
results obtained for different ZnO crystals (without and with magnetic field (H = 100 kOe)) considering the case yp = 0 and jу = 0 (Table 7.5) and у ф 0 and jy ф 0 (Table 7.6). The angle of ATR prism was a = 30°, 35°, and 50°.
As one can see from Tables 7.5 and 7.6, the increase of both the angles of ATR prism and free carrier concentration in ZnO causes the Tsp rise. The effect of plasmon-phonon damping and external magnetic field on Tp and Tsp is similar.
The results presented in this section showed the effect of strong uniform magnetic field on the plasmon and plasmon-phonon properties of optically anisotropic ZnO single crystals. This effect is the stronger as the higher concentration of free carriers. This can lead to the appearance of additional dispersion branch. This latter corresponds to the excitation of a “pure” phonon dispersion branch and demonstrates gradual shift toward higher frequencies caused by
TABLE 7.5
Half-width of the minimum of ATR spectrum (Гр) and the damping coefficient (Tsp) for ZnO crystals with different electron concentrations. yp = 0 and = 0, H = 0 and 100 kOe

|

|

|
||||||

|

|

|

|

|

|

|

|
|
|
Z02-3 (n0 = 9.3 х 1016 cm ') |
||||||||
|
30 |
518 |
1.626 |
9.7 |
6.96 |
518 |
1.629 |
10.08 |
7.07 |
|
35 |
537 |
1.936 |
25.4 |
21.43 |
538 |
1.975 |
35.68 |
30.71 |
|
50 |
551 |
2.595 |
202.75 |
188.2 |
552 |
2.77 |
336.6 |
314.48 |
|
ZOl-3 («0 = 6.6 X 1017 cm"3) |
||||||||
|
30 |
527 |
1.646 |
22.54 |
15.68 |
528 |
1.68 |
36.13 |
25.16 |
|
35 |
550 |
1.98 |
114.58 |
91.89 |
551 |
2.11 |
243.48 |
191.03 |
|
50 |
563 |
2.44 |
— |
— |
564 |
— |
— |
|
|
ZQ6-B (no = 2.0 X 10,S cm ’) |
||||||||
|
30 |
555 |
1.735 |
248.57 |
121.53 |
557 |
1.83 |
— |
268.45 |
|
35 |
576 |
1.95 |
547.11 |
325.65 |
574 |
— |
— |
— |
|
50 |
585 |
— |
— |
— |
582 |
— |
— |
— |
TABLE 7.6
Half-width of the minimum of ATR spectrum (Гр) and the damping coefficient (Tsp) for ZnO crystals with different electron concentration. yp = 0 and yf = 0, H = 0 and 100 kOe

|

|

|
||||||

|

|

|

|
|

|

|

|
|
|
Z02-3 (л0 = 9.3 х К)16 cm ') ()>рх = 150 cm-1; урц = 170 cm-1; j>fxj| = 11 cm ') |
||||||||
|
30 |
518 |
1.63 |
10.59 |
7.04 |
518 |
1.632 |
11.13 |
7.12 |
|
35 |
537 |
1.945 |
24.93 |
21.86 |
538 |
1.985 |
35.22 |
31.23 |
|
50 |
551 |
2.63 |
209.67 |
197.41 |
552 |
2.805 |
353.45 |
328.61 |
|
ZOl-3 (nu = 6.6 x Ю17 cm 3) ()>px = 280 cm-1; урц = 260 cm-1; j>fxj| = 13 cm ') |
||||||||
|
30 |
527 |
1.67 |
23.73 |
17.11 |
528 |
1.7 |
35.69 |
27.52 |
|
35 |
550 |
2.06 |
132.29 |
111.68 |
551 |
2.17 |
270.52 |
216.5 |
|
50 |
563 |
2.7 |
— |
564 |
— |
— |
— |
|
|
Z06-B («о = 2.0 x I018 cm 3) (yp, = 406 cm l; /рц = 350 cm-1; yf ,ц = 21 cm ') |
||||||||
|
30 |
555 |
1.86 |
197.25 |
557 |
1.94 |
410.19 |
||
|
35 |
576 |
2.26 |
— |
574 |
2.38 |
741.25 |
720.1 |
|
|
50 |
585 |
— |
— |
582 |
2.85 |
872.47 |
853.34 |
|
the increasing of the magnitude of the external magnetic field. The “start” frequency and the behavior of this “pure” phonon dispersion branch depend on carrier concentration and the magnitude of the magnetic field. The application of the magnetic field results leads also to the transformation of the low-frequency dispersion branch, whereas the high-frequency one remains unchangeable within the accuracy of the experiment. Besides, the application of magnetic field results also in the variation of damping coefficient values.

