Tversky and Kahneman – Biases and heuristics
Representativeness
One of the ways in which we categorize objects and people is through what Tversky and Kahneman refer to as representativeness: ‘when A is highly representative of B. the probability that A originates from B is judged to be high. On the contrary, if A is not similar to B, the probability that A originates from B is judged to be low’ (Tversky & Kahneman, 1974, p. 1124). Kahneman and Tversky (1973) conducted a number of experiments on the representativeness heuristic. In one, the participants in one group (the low engineer group) are told that personality tests have been administered to 30 engineers and 70 lawyers and that thumbnail descriptions have been written for them. Participants are then given one of them:
Jack is a 45-year-old man. He is married and has four children. He is generally conservative, careful, and ambitious. He shows no interest in political and social issues and spends most of his free time on his many hobbies which include home carpentry, sailing, and mathematical puzzles.
The probability that Jack is one of the 30 engineers in the sample of 100 is__%. (p. 241)
The description does not contain any explicit reference to his occupation, but it does contain stereotypical features of an engineer. Participants in another group (the high engineer group) are told that there are 70 engineers and 30 lawyers. For the first group, the odds that Jack is an engineer is 3/7 and for the second it is 7/3. However, in both cases, participants ignored these prior probabilities and both groups made essentially the same probability judgements. Participants who were given no description predicted that Jack was an engineer only 30% of the time in the low engineer group, and those in the high engineer group predicted that he was an engineer 70% of the time. Strangely, perhaps, even an uninformative description led the participants to ignore the base rates: ’Dick is a 30-year-old man. He is married with no children. A man of high ability and high motivation, he promises to be quite successful in his field. He is well liked by his colleagues’ (Kahneman & Tversky, 1973, p. 242). The likelihood that this person was an engineer was estimated by both groups to be 50/50.
In 1982, Tversky and Kahneman presented another famous study in psychology which has not only made its way into textbooks but also into works of fiction. In this study, people were given a statement describing someone and then asked to rank a list of items in terms of their probability based on that description. One of the statements read:
Linda is 31 year old, single, outspoken, and very bright. She majored in philosophy. As a student, she was deeply concerned with issues of discrimination and social justice, and also participated in antinuclear demonstrations. Please check off the most likely alternative:
The items people had to rank included, amongst others: Linda is a teacher in elementary school; Linda is active in the feminist movement; Linda is a bank teller. In some versions, Tversky and Kahneman reduced the choices to just these two:
‘Linda is a bank teller'.
‘Linda is a bank teller and is active in the feminist movement’.
The participants in various versions of the study were likely to rank 'Linda is a bank teller and is active in the feminist movement" above ‘Linda is a bank teller". This ranking is irrational. The set of people who are bank tellers must be greater than the set of people who are bank tellers and active in the feminist movement as in Figure 5.3.
They referred to this as the conjunction fallacy where combining the two features is seen by participants as more likely than a single feature. To point out the fallacy, Manktelow (2012) likened this to saying that there are ‘more guard dogs than dogs'.
In a review of a number of studies in 1982, Tversky and Kahneman (1982, p. 298) stated that ‘Subjects ranked the outcomes based on the degree to which they matched the stereotypes'. Although this is referred to as the conjunction fallacy in the case of the Linda scenario, or failing to pay attention to the base rate in the case of Jack, when people are reading these descriptions, they are trying to get as much information out of
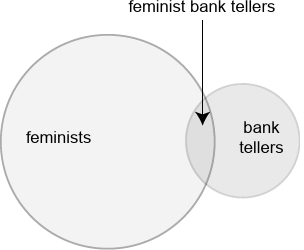
figure 5.3 A representation of the space of feminists and the space of bank tellers and the conjunction between them.
them as possible by applying their knowledge of the world in the form of schemas or stereotypes triggered by the descriptions. So, if Linda happens to be a bank teller, the description of her as being concerned with issues of discrimination and social justice suggests that it is not unreasonable for her to be active in the feminist movement as well. So here, what Tversky and Kahneman refer to as intuition trumps logic.
As we have seen, the representativeness heuristic can cause people to ignore the base rate (e.g., the proportion of engineers to lawyers). Hence, Tversky and Kahneman (1971) suggested that many people had mistaken intuitions about the laws of chance. They tend to assume, for example, that a sample should have the same properties as the population from which it has come, based on the representativeness heuristic. They referred to this as the belief in the law of small numbers. A simple example of this uses coin tosses where the proportion of heads to tails in a short sequence of coin tosses may not match the proportion you would get in a long sequence of tosses. This is the law of large numbers. You cannot expect a short run of heads and tails to represent a long run. Figure 5.4 shows a number of coin tosses. The first selection shows three heads and three tails in a 'random' order. The other two sets of coin tosses do not represent the randomness of the long sequence and so

figure 5.4 A number of coin tosses from a long run which three short run samples have been highlighted.
people might be tempted to think that they are not in fact randomly generated. People who make inferences on this basis are using the representativeness heuristic.
Tversky and Kahneman (1974) provide another example where their subjects ignored the sample size despite it being emphasized. In the description below, there is a small hospital and a larger one with the average number of births being greater for the larger one than the smaller one:
A certain town is served by two hospitals. In the larger hospital about 45 babies are born each day, and in the smaller hospital about 15 babies are born each day. As you know, about 50% of all babies are boys. However, the exact percentage varies from day to day. Sometimes it may be higher than 50%, sometimes lower.
For a period of one year, each hospital recorded the days on which more than 60% of the babies born were boys. Which hospital do you think recorded more such days?
- • The larger hospital (21);
- • The smaller hospital (21);
- • About the same (that is, within 5% of each other) (53).
The values in parentheses are the number of undergraduate students who chose each answer. Here again, a small sample is likely to veer away from the average seen in a large sample. The larger the sample, the closer it gets to the full population which, like the coin tosses, is going to be approximately 50% boys and 50% girls. However, most of the students picked the third option. Tversky and Kahneman (1974, p. 1125) concluded: ‘This fundamental notion of statistics is evidently not part of people’s repertoire of intuitions'.

