The Body Uses Chemical Energy
Acknowledging the joule’s place in the SI, this book, as noted, follows convention in expressing energy in calories, which are available as carbohydrates, fat, and protein. In the nineteenth century, scientists sought to define these units in chemical terms. Their starting point was the insights of two eighteenth-century French chemists. Many chemists and historians of science regard the more famous of the two, Antoine Lavoisier (1743-1794), as a founder of chemistry and “Father of Nutritional Science.”" Unquestionably, he did much to emancipate it from alchemy, helping expand the experimental methods of modern science in the process. Among other accomplishments, his experiments demonstrated that plants consist of the elements carbon (C), hydrogen (H), oxygen (O), sulfur (S), and phosphorus (P). To these, his compatriot Claude-Louis Berthellot (1748-1822) added nitrogen (N, not to be confused with newton). He and Lavoisier did not identify all elements in plants, but their contributions were a start. Their work applied to nutrition. In eating plants, people ingest these elements, w'hich nourish them. Put another way, carbon, hydrogen, sulfur, and the rest must give people energy, help them use it, serve as the body’s building blocks, or some combination of these possibilities. This insight charged chemists with the task of describing how combinations of these elements, known as molecules, energized the body.
The fact that energy comes from molecules undergirds this chapter. As in the nineteenth century, our focus is on the molecules of energy: carbohydrates, fat, and protein, which later sections examine. Here, brief definitions must suffice. Carbohydrates include sugars and their constructs starch and glycogen. The formula is C@(H20)#, where @ and # are positive integers. Where @ equals, the ratio of carbon to hydrogen to oxygen simplifies to 1:2:1. The presence of water (H20) in this formula occasioned the name “hydrates of carbon,” known simply as carbohydrates.
Just as starch and glycogen, both discussed later, are aggregates of sugars, fat, a class of lipids, is constructed from simpler molecules: fatty acids and the alcohol glycerol (C,H803), also known as glycerin (sometimes spelled glycerine). A fatty acid has a carboxylic acid at one end, which is probably best understood by inspection of its structure:

FIGURE 2.1 Carboxylic acid. (Structure from ChemDraw.)
The lines denote bonds, of which carbon forms four. In this diagram, the central carbon accounts for these four with a double bond to oxygen and single bonds each to a hydroxyl group (OH) and R. R denotes a chain with a spine of bonded carbon atoms of unspecified length. In a fatty acid, R almost always has an even number of carbons, typically four to twenty-four. At R’s other end in a fatty acid is a methyl group (CH3), the name taken from methane, a single carbon bonded to four hydrogens (CH4).
Turning to the alcohol, glycerol has the structure:
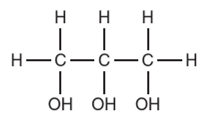
FIGURE 2.2 The alcohol glycerol. (Structure from ChemDraw.)
A fatty acid and glycerol may combine to form a fat molecule as illustrated by the following diagram.

FIGURE 2.3 Formation of triglyceride. (Structure from ChemDraw.)
Note that hydrogen in glycerol and the hydroxyl group in the fatty acid—each within a rectangle in Figure 2.3—play important roles in forming the above fat molecule. Hydrogen has a positive charge (H+), and the hydroxyl group has a negative charge (OH"). These opposites attract so that H+ and OH" form H20. This reaction liberates or releases water and is known as dehydration. The liberation of water leaves the oxygen in glycerol to bond with the carbon that had been part of the terminal carboxylic acid in the fatty acid to form the fat molecule. In this case, the result is a triglyceride (also rendered triacylglycerol or TAG), named after the three- part structure.
Proteins contain nitrogen in an amine (NH2), taking the form:

FIGURE 2.4 Amine group. (Structure from ChemDraw.) This amine combines with a carboxyl group to form:

FIGURE 2.5 Example of protein. (Structure from ChemDraw.)
The linkage between carbon and nitrogen, shown within a rectangle for emphasis in Figure 2.5, is a peptide bond and signifies proteins.
Returning to a general discussion of energy, a piece of laboratory equipment known as a bomb calorimeter measures calories in carbohydrates, fat, and protein. Numbers may vary, clustering near 3.6 calories per gram for the sugar glucose (C6H:206), 4.1 for starch, 5.6 for protein, and 9.4 for fat.12 Note that glucose and starch, both carbohydrates, differ by half a calorie per gram, debunking the generalization that all carbohydrates have about 4 calories per gram as too imprecise for comfort. Having the most calories by mass, fat is the richest energy source. Alcohol also has calories but will not receive treatment in order to focus on foods rather than beverages. Admittedly the distinction between food and beverage is somewhat arbitrary. Any nourishment may be classified as food. For this reason, part of Chapter 7 examines milk in the conviction that it qualifies as food and beverage. Carbohydrates, fat, and protein aside, the body requires minerals, vitamins, possibly some phytochemicals, and water, none of which has calories.
A focus on carbohydrates, fat, and protein yields the observation that carbohydrates, despite their status as pariahs, have under half the calories in fat by mass. In fact, the disaccharide sucrose (Cl2H220„) has just one-third the calories in fat. A dieter who shuns this sugar (see below and Chapter 11) for olive oil (see Chapter 10) in the belief that it is a “healthy fat” but who does not reduce portions risks tripling calories. This switch is questionable from the perspective of mass reduction or maintenance.
From this observation follows the consequence that foods with carbohydrates but little fat tend to have fewer calories than those laden with oil, butter, ghee, margarine, cream, lard, or kindred products (see Chapters 7 and 10 for discussion of dairy and fat, respectively). The emphasis should be on whole foods rather than their processed counterfeits, which usually have plentiful sugars, fat, and salt but few minerals, vitamins, and phytochemicals and little protein.
Tables 2.1 and 2.2 show the difference between low- and high-fat foods. Among low-fat options per 100 grams (3.5 ounces) fresh, celery (Apium graveolens) has roughly sixteen calories, cabbage (mentioned earlier) and cucumber (Cucumis sativus) eighteen, mushroom (Agaricus bisporus and other edible species) and spinach (Spinacia oleracea) twenty-three, watermelon (Citrullus lanatus) twenty- nine, strawberry (Fragaria x ananassa) thirty-five, and carrot (Daucus carota) thirty-nine.13 Even the potato—mentioned above and whose nutrition Chapter 13 discusses—despite its reputation as fattening in some circles, has just seventy-nine calories per 100 grams fresh.14 Among fatty whole foods per 100 grams fresh, olives (Olea europaea) have about 104 calories, avocados (Persea Americana) 117, egg yolks 322, pistachios (Pistacia vera) and peanuts (Arachis hypogaea) 560, cashews (Anacardium occidentale) 578, almonds (Primus dulcis) 595, and walnuts (Juglans species) 613.15
These comparisons should not be construed as justification for eliminating fat from the diet because some whole foods rich in them—egg yolk for example—have many nutrients. Moreover, as a later section emphasizes, the body cannot manufacture all fatty acids, making necessary ingestion of those essential to health. At the same time and as noted abundant fatty foods may make the dieter gain unwanted kilograms, a problem that inactivity compounds.
The amount of energy in foods is not identical to how many calories the body absorbs because digestion is imperfect. As a rule, the body absorbs between 97 and 99 percent of the carbohydrates it ingests, 95 percent of fat, and 92 or 93 percent of protein.16 Digestibility, like other aspects of nutrition, is subject to revision in the light of new research. For example, U.S. Department of Agriculture (USDA) scientists announced in 2018 that the body absorbs fewer calories from almonds, pistachios, and walnuts—all mentioned in the previous paragraph as caloric foods because of fat content—than
TABLE 2.1
Calories and Fat in Low Fat Foods
|
Food (100 g) |
Fat (g) |
Calories |
|
Celery |
0 |
16 |
|
Cabbage |
0.16 |
18 |
|
Cucumber |
0 |
18 |
|
Mushroom |
0 |
23 |
|
Spinach |
0 |
23 |
|
Watermelon |
0 |
29 |
|
Strawberries |
0.3 |
35 |
|
Carrot |
0 |
39 |
|
Potato |
0 |
79 |
TABLE 2.2
Calories and Fat in Fatty Foods
|
Food (100 g) |
Fat (g) |
Calories |
|
Olives |
21.16 |
104 |
|
Avocado |
9.8 |
117 |
|
Egg yolks |
21.2 |
322 |
|
Pistachios |
45.5 |
560 |
|
Peanuts |
49.3 |
560 |
|
Cashews |
49 |
578 |
|
Almonds |
52.5 |
595 |
|
Walnuts |
59.5 |
613 |
nutritionists previously thought.17 Additionally, as noted later, little protein is available as energy because the body needs most for muscles.
Humans and other animals must consume food for energy because, Chapter 3 emphasizes, they are heterotrophs, organism that cannot manufacture energy and nutrients, except for vitamin D in the presence of sunlight. Heterotrophs contrast with autotrophs—plants, algae, and photosynthetic bacteria—which use sunlight for energy. Heterotrophs use food to fuel the chemical reactions that sustain life. Absent food’s energy, cessation of these reactions causes death. The fact that life requires energy raises the issue of quantification: How much energy does the body need for maintenance, growth, and reproduction? This question is difficult to answer given that several factors influence requirements.
Rather than a rigid amount, Tables 2.3 and 2.4 indicate that the U.S. Department of Health and Human Services (HHS) in Washington, DC recommended that women consume between 1,600 and 2,400 calories daily and men between 2,400 and 3,200.18 The department’s calculations by age and activity represent a curve whereby number of calories increases until roughly age twenty, after which it decreases.
TABLE 2.3
Calorie Requirements for Women from HHS
|
Age (yr) |
Sedentary (cal) |
Moderately active (cal) |
Active (cal) |
|
2 |
1,000 |
1.000 |
1.000 |
|
3 |
1,000 |
1.200 |
1.400 |
|
4 |
1.200 |
1.400 |
1.400 |
|
5 |
1.200 |
1.400 |
1.600 |
|
6 |
1.200 |
1.400 |
1.600 |
|
7 |
1.200 |
1.600 |
1.800 |
|
8 |
1,400 |
1.600 |
1.800 |
|
9 |
1,400 |
1.600 |
1.800 |
|
10 |
1,400 |
1.800 |
2.000 |
|
11 |
1,600 |
1.800 |
2.000 |
|
12 |
1,600 |
2.000 |
2.200 |
|
13 |
1,600 |
2.000 |
2.200 |
|
14 |
1,800 |
2.000 |
2.400 |
|
15 |
1,800 |
2.000 |
2.400 |
|
16 |
1,800 |
2.000 |
2.400 |
|
17 |
1,800 |
2.000 |
2.400 |
|
18 |
1,800 |
2.000 |
2.400 |
|
19-20 |
2,000 |
2.200 |
2.400 |
|
21-25 |
2,000 |
2.200 |
2.400 |
|
26-30 |
1,800 |
2.000 |
2.400 |
|
31-35 |
1,800 |
2.000 |
2.200 |
|
36-40 |
1,800 |
2.000 |
2.200 |
|
41-45 |
1,800 |
2.000 |
2.200 |
|
46-50 |
1,800 |
2.000 |
2.200 |
|
51-55 |
1,600 |
1.800 |
2.200 |
|
56-60 |
1,600 |
1.800 |
2.200 |
|
61-65 |
1,600 |
1.800 |
2.000 |
|
66-70 |
1,600 |
1.800 |
2.000 |
|
71-75 |
1,600 |
1.800 |
2.000 |
|
76+ |
1,600 |
1.800 |
2.000 |
TABLE 2.4
Calorie Requirements for Men from HHS
|
Age (yr) |
Sedentary (cal) |
Moderately active (cal) |
Active (cal) |
|
2 |
1,000 |
1.000 |
1.000 |
|
3 |
1,000 |
1.400 |
1.400 |
|
4 |
1.200 |
1.400 |
1.600 |
|
5 |
1.200 |
1.400 |
1.600 |
|
6 |
1,400 |
1.600 |
1.800 |
|
7 |
1,400 |
1.600 |
1.800 |
|
8 |
1,400 |
1.600 |
2.000 |
|
9 |
1,600 |
1.800 |
2.000 |
|
10 |
1,600 |
1.800 |
2.200 |
|
11 |
1,800 |
2.000 |
2.200 |
|
12 |
1,800 |
2.200 |
2.400 |
|
13 |
2,000 |
2.200 |
2.600 |
|
14 |
2,000 |
2.400 |
2.800 |
|
15 |
2,200 |
2.600 |
3.000 |
|
16 |
2,400 |
2.800 |
3.200 |
|
17 |
2,400 |
2.800 |
3.200 |
|
18 |
2,400 |
2.800 |
3.200 |
|
19-20 |
2,600 |
2.800 |
3.000 |
|
21-25 |
2,400 |
2.800 |
3.000 |
|
26-30 |
2,400 |
2.600 |
3.000 |
|
31-35 |
2,400 |
2.600 |
3.000 |
|
36-40 |
2,400 |
2.600 |
2.800 |
|
41-45 |
2,200 |
2.600 |
2.800 |
|
46-50 |
2,200 |
2.400 |
2.800 |
|
51-55 |
2,200 |
2.400 |
2.800 |
|
56-60 |
2,200 |
2.400 |
2.600 |
|
61-65 |
2,000 |
2.400 |
2.600 |
|
66-70 |
2,000 |
2.200 |
2.600 |
|
71-75 |
2,000 |
2.200 |
2.600 |
|
76+ |
2,000 |
2.200 |
2.400 |
Readers may compare HHS’s numbers with those from American nutritionist and microbiologist Anne E. Maczulak in Tables 2.5 and 2.6, though she omitted the category “moderately active.”19
Science authors and editors Louise Eaton and Kara Rogers estimated women and men’s daily calorie requirements between 2,000 and 4,000.20 Dutch historian Willem Marinus Jongman put daily needs, in Table 2.7, between 2,200 and 2,903 calories for men between ages fifteen and seventy and between 1,883 and 2,400 for women between these years.21 His numbers for men peaked at age twenty and for women at age fifteen, diminishing thereafter.
Table 2.8’s estimates came from British physician and nutritionist Sarah Brewer. Omitting activity, Brewer recommended 2,294-3,155 calories for men between ages fifteen and seventy-five, with intake peaking at age eighteen.22 Her calories for women between these ages were 1,840-2,462, with the apex at ages seventeen and eighteen.
Calorie requirements vary with activity. Even during deepest sleep, when someone is least active, the body needs energy to circulate blood, breathe, and perform other minimal functions. As the previous paragraph implied, the body’s chemical reactions do not cease when a person is inactive,
TABLE 2.5
Calorie Requirements for Women from Maczulak
|
Age (yr) |
Sedentary (cal) |
Active (cal) |
|
2-3 |
1.000 |
1.400 |
|
4-8 |
1.200 |
1.800 |
|
9-13 |
1.600 |
2.200 |
|
14-18 |
1.800 |
2,400 |
|
19-30 |
2.000 |
2,400 |
|
31-50 |
1.800 |
2,200 |
|
51+ |
1.600 |
2,200 |
TABLE 2.6
Calorie Requirements for Men from Maczulak
|
Age (yr) |
Sedentary (cal) |
Active (cal) |
|
2-3 |
1.000 |
1.400 |
|
4-8 |
1.200 |
2.000 |
|
9-13 |
1.800 |
2.600 |
|
14-18 |
2.200 |
3.200 |
|
19-30 |
2.400 |
3.000 |
|
31-50 |
2.200 |
3.000 |
|
51+ |
2.000 |
2.800 |
TABLE 2.7
Calorie Requirement for Men and Women from Jongman
|
Age (yr) |
Men (cal) |
Women (cal) |
|
1 |
757 |
700 |
|
5 |
1323 |
1226 |
|
10 |
1984 |
1762 |
|
15 |
2700 |
2400 |
|
20 |
2903 |
2285 |
|
25 |
2683 |
2083 |
|
30 |
2683 |
2083 |
|
35 |
2600 |
2117 |
|
40 |
2600 |
2117 |
|
45 |
2600 |
2117 |
|
50 |
2600 |
2117 |
|
55 |
2600 |
2117 |
|
60 |
2600 |
2117 |
|
65 |
2200 |
1883 |
|
70 |
2200 |
1883 |
TABLE 2.8
Calorie Requirements for Men and Women from Brewer
|
Age |
Men (cals) |
Women (cals) |
|
0-2 mo |
574 |
502 |
|
3^t mo |
598 |
550 |
|
5-6 mo |
622 |
574 |
|
7-12 mo |
718 |
646 |
|
lyr |
765 |
717 |
|
2 yr |
1.004 |
932 |
|
3yr |
1.171 |
1.076 |
|
4yr |
1.386 |
1.291 |
|
5yr |
1.482 |
1.362 |
|
6 yr |
1.577 |
1.482 |
|
7yr |
1.649 |
1.530 |
|
8 yr |
1.745 |
1.625 |
|
9 yr |
1.840 |
1.721 |
|
10 yr |
2,032 |
1.936 |
|
11 yr |
2,127 |
2,032 |
|
12 yr |
2,247 |
2,103 |
|
13 yr |
2,414 |
2,223 |
|
14 yr |
2,629 |
2.342 |
|
15 yr |
2.820 |
2.390 |
|
16 yr |
2.964 |
2,414 |
|
17 yr |
3,083 |
2.462 |
|
18 yr |
3,155 |
2.462 |
|
19-24 yr |
2.772 |
2,175 |
|
25-34 yr |
2,749 |
2,175 |
|
35^14 yr |
2,629 |
2,103 |
|
55-64 yr |
2,581 |
2.079 |
|
65-74 yr |
2.342 |
1.912 |
|
75+ yr |
2.294 |
1.840 |
though they are slower than during exertion. The energy needed to maintain the body during rest, known as basal metabolism (basal metabolic rate or BMR), represents roughly 45-65 percent of daily expenditures.23 Applying the mean of 55 percent to the HHS figures and assuming equilibrium between energy intake and outlay, BMR should be between 880 and 1,320 calories per day for women and between 1,320 and 1,760 for men.
Activity uses energy, though many factors modify the total. Recalling physics’ definitions of work and energy, activity that requires the body to move some distance necessarily burns calories. The amount depends on several variables, mass being one. In the vernacular, the question of heaviness becomes and attempt to fix an object’s weight, but weight and mass differ. Weight depends on gravity whereas mass, being the amount of matter, is independent of gravity. That is, mass never varies when the amount of matter is constant, whereas the weight of a static unit of matter changes with the pull of gravity. A 100-pound object on Earth—the pound being the English unit of weight—weighs just 16.5 pounds on the moon, but 100 kilograms, being mass, are 100 kilograms everywhere in the universe. Consistency and conformity to the SI mandate that this book favors mass over weight, though as a courtesy it supplies both, with weight in parentheses and in English units.
Many sports and recreational pursuits, for example, walking, jogging, bicycling, and tennis, require the body to move. Because the body is the load, its mass affects metabolism such that the heavier the mass the more energy is necessary to move it. Distance is also an issue because, all else equal, more energy is needed the greater the distance to be traversed. These factors are evident in daily life. Revisiting the hypothetical grass cutter, his exertions will be more strenuous, and he will burn more calories, the heavier the mower and the larger the yard.
The foregoing acknowledges that variables complicate calculation of calories metabolized per activity, undermining the generality that a walker, for example, burns roughly 60 calories per kilometer (100 calories per mile).24 Beyond mass, hilliness and ruggedness of terrain, wind, and physiological responses to temperature modify demand for energy. Speed is another consideration, though its effect on metabolism can be exaggerated. At greater velocities, exertions per unit time increase, creating a sensation that the activity burns more calories even when work is constant.
Although calculation of energy metabolized per activity is fraught with difficulties, active people burn many calories. In 2009, United Kingdom (UK) pharmacologist Paul Clayton and historian Judith D. Rowbotham (b. 1952), both introduced in Chapter 1, estimated that the arduousness of life and work about 1850 led British women to burn between 2,750 and 3,500 calories per day and men between 3,000 and 4,500.25
Such vigor was not anomalous. On the eve of the potato famine in 1845, Irish men ate as many as
- 9.5 kilograms (21 pounds) of potatoes daily, though between 4.5 and 6.5 kilograms (10 and 14 pounds) might be safer estimates.26 Where and when available, other vegetables, cabbage and turnips chief among them, and milk or buttermilk (see Chapter 7) supplemented the diet. Omitting milk and other vegetables yields an upper bound of 7,315 calories daily given a USDA estimate of 770 calories per kilogram of potatoes.27 Given this number’s enormity, a realistic figure may be derived from 4.5 to 6.5 kilograms of potatoes daily, or between 3,465 and 5,005 calories per day. Irish laborers were not overweight, suggesting equilibrium between intake and expenditure. They may therefore have burned between 3,465 and
- 5.005 calories daily, a range that does not contradict Clayton and Rowbotham’s estimates.

