Nutrients in Fish
Beyond economic and geographic considerations, fish has the most vitamin D of any food and ample selenium, iodine, calcium, phosphorus, iron, zinc, vitamins A, B, (niacin or nicotinic acid), B6 (pyridoxine), and B,2 (cobalamin), protein, and omega 3 fatty acids.34 “Indeed, with their unsaturated fats, vitamins, minerals, and trace elements, fish and shellfish constitute a near-perfect food for the human body,” wrote American aquaculture researcher Colin E. Nash in 2000.35 With less fat and fewer calories than many meats, fish and shellfish attract dieters.
Cod (Gadus morhua and G. macrocephalus) supplies abundant protein, phosphorus, and vitamins B, and Bl2. Sardines (Sardina pilchardus) are rich in vitamins B„ B12, and D, selenium, phosphorus, calcium, iron, protein, and omega 3 fatty acids. One hundred grams of mackerel (species in genera Rastrelliger and Scomber) have above the U.S. Food and Drug Administration’s (FDA) daily value (DV) of vitamins Bl2 and D and plentiful protein, magnesium, potassium, and vitamin B6. Fish tends to provide more protein, vitamins, and minerals per calorie than livestock. Like meat, fish lacks vitamin C, fiber, and phytochemicals. Chapter 2 discussed these nutrients and others. Table 5.1 lists calories and nutrients in tuna, tilapia, pollock, cod, and mackerel.36
TABLE 5.1
Nutrients in Fishes 100g
|
Nutrient |
Tuna |
%DV |
Tilapia |
%DV |
Pollock |
%DV |
Cod |
%DV |
Mackerel |
%DV |
|
Calories |
86 |
N/A |
96 |
N/A |
56 |
N/A |
82 |
N/A |
189 |
N/A |
|
Protein (g) |
25.5 |
N/A |
20.08 |
N/A |
12.19 |
N/A |
17.81 |
N/A |
19.08 |
N/A |
|
Fat (g) |
0.96 |
N/A |
1.70 |
N/A |
0.41 |
N/A |
0.67 |
N/A |
11.91 |
N/A |
|
Carbs (g) |
0 |
N/A |
0 |
N/A |
0 |
N/A |
0 |
N/A |
0 |
N/A |
|
Fiber(g) |
0 |
N/A |
0 |
N/A |
0 |
N/A |
0 |
N/A |
0 |
N/A |
|
Minerals |
||||||||||
|
Ca (mg) |
17 |
1.7 |
10 |
1 |
15 |
1.5 |
16 |
1.6 |
16 |
1.6 |
|
Fe (mg) |
1.53 |
9 |
0.56 |
3.1 |
0.22 |
1.2 |
0.38 |
2.1 |
1.48 |
8.2 |
|
Mg (mg) |
23 |
5.8 |
27 |
6.8 |
16 |
4 |
32 |
8 |
60 |
15 |
|
P (mg) |
163 |
16.3 |
170 |
17 |
284 |
28.4 |
203 |
20.3 |
187 |
18.7 |
|
К (mg) |
179 |
5.1 |
302 |
8.6 |
160 |
4.6 |
413 |
11.8 |
344 |
9.8 |
|
Na (mg) |
247 |
10.3 |
52 |
2.2 |
333 |
13.9 |
54 |
2.3 |
89 |
3.7 |
|
Zn (mg) |
0.77 |
5.1 |
0.33 |
2.2 |
0.31 |
2.1 |
0.45 |
3 |
0.64 |
4.3 |
|
Cu (mg) |
0.05 |
3 |
0.08 |
4 |
0.04 |
2 |
0.03 |
1.5 |
0.08 |
4 |
|
Mil (mg) |
0.01 |
0.5 |
0.04 |
2 |
0.01 |
0.5 |
0.02 |
1 |
0.02 |
1 |
|
Se (meg) |
70.6 |
101 |
41.8 |
59.7 |
15.9 |
22.7 |
33.1 |
47.3 |
41.6 |
59.4 |
(Continued)
TABLE 5.1 (Continued) Nutrients in Fishes 100g
|
Nutrient |
Tuna |
%DV |
Tilapia |
%DV |
Pollock |
%DV |
Cod |
%DV |
Mackerel |
%DV |
|
Vitamins |
||||||||||
|
A (IU) |
20 |
0.4 |
0 |
0 |
46 |
0.9 |
40 |
0.8 |
167 |
3.3 |
|
B, (mg) |
0.03 |
2 |
0.04 |
2.4 |
0.03 |
2 |
0.08 |
4.7 |
0.16 |
10.7 |
|
B, (mg) |
0.07 |
4.1 |
0.06 |
3.5 |
0.08 |
4.7 |
0.07 |
4.1 |
0.35 |
20.6 |
|
B3(mg) |
13.28 |
66.4 |
3.9 |
19.5 |
0.65 |
3.3 |
2.06 |
10.3 |
8.83 |
44.2 |
|
B5 (mg) |
0.12 |
1.2 |
0.49 |
4.9 |
0.36 |
3.6 |
0.15 |
1.5 |
0.86 |
8.6 |
|
B6(mg) |
0.32 |
16 |
0.16 |
8 |
0.07 |
3.5 |
0.25 |
12.5 |
0.38 |
19 |
|
B,(mcg) |
4 |
1 |
24 |
6 |
3 |
0.8 |
7 |
1.8 |
1 |
0.3 |
|
В l2 (meg) |
2.55 |
42.5 |
1.58 |
26.3 |
1.63 |
27.2 |
0.91 |
15.2 |
7.29 |
121.5 |
|
C (mg) |
0 |
0 |
0 |
0 |
0 |
0 |
1 |
1.7 |
0.9 |
1.5 |
|
D (IU) |
80 |
20 |
124 |
31 |
42 |
10.5 |
36 |
9 |
643 |
160.8 |
|
E (mg) |
0.33 |
2.2 |
0.40 |
2.7 |
0.49 |
3.3 |
0.64 |
4.3 |
1.35 |
9 |
|
К (meg) |
0.2 |
0.3 |
1.4 |
1.8 |
0.1 |
0.1 |
0.1 |
0.1 |
3.4 |
4.3 |
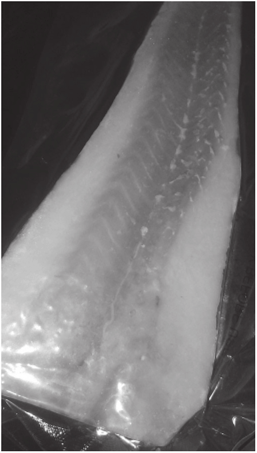
FIGURE 5.5 Cod. (Photo from author.)
Nutrients in Shellfish
In addition to fish, aquatic environments supply shellfish. Although nutritionists and dieticians group both as seafood, shellfish resembles insects more than fish in lacking bones, making both invertebrates. Shellfish includes mollusks, which may encompass 100,000 species.37 Unlike insects, mollusks lack legs. Their calcium carbonate (CaCO,) shell may be a single unit as is true of snails (species in the class Gastropoda) or two as with clams (species in the class Bivalvia). Mollusks also include oysters (species in the genera Ostrea, Crassostrea, Ostreola, Magallana, and Saccostrea), mussels, scallops (species in the family Pectinoidea), limpets (Patella vulgata), and cockles (Cerastoderma edule).
The second class of shellfish, the subphylum Crustacea, matches insects in having exoskeletons of the tough organic compound chitin and calcium. Crustaceans have four antennae, a head, mouth, body, and ten appendages. Examples include crabs (species in the infraorder Brachyura), shrimp (species in the infraorder Caridea), lobster (species in the family Nephropidae), crayfish (species in the families Astacidae, Parastacidae, and Austraostracidae), krill (species in the order Euphausiacae), and barnacles (Cirripedia species).
Nutrients depend on type, though shellfish often have protein, iodine, selenium, and vitamin A. Mostly water, they have little fat and few calories. When cooked to remove much water, shrimp, crab, clams, and mussels are over half protein by mass.38 One hundred grams of shrimp have 71 calories,
20.9 grams of protein, 1.1 grams of fat, no carbohydrates, 54 milligrams of calcium, 22 milligrams of magnesium, and 3.09 milligrams of iron.39 One hundred grams of lobster contain 77 calories, 0.75 grams of fat, no carbohydrates, 16.52 grams of protein, 200 milligrams of potassium, and small quantities of iron and vitamin C. One hundred grams of mussels supply 115 calories, 2.6 grams each of fat and carbohydrates, 21.2 grams of protein, 50 milligrams of calcium, 2.1 milligrams of iron, and 36 micrograms of vitamin A.40 Some nutritionists recommend mussels for vitamin Br2 and crab, shrimp, lobster, prawn, and crayfish for selenium.41 As noted, shells supply calcium. Despite these benefits, shellfish may contain abundant cholesterol and sodium.
Table 5.2 shows calories and nutrients in shrimp, oysters, lobster, clams, and crab.42
TABLE 5.2
Nutrients in Shellfish 100g
|
Nutrient |
Shrimp |
%DV |
Oysters |
%DV |
Lobster |
%DV |
Clams |
%DV |
Crab |
%DV |
|
Calories |
71 |
N/A |
51 |
N/A |
77 |
N/A |
86 |
N/A |
87 |
N/A |
|
Protein (g) |
20.9 |
N/A |
14.1 |
N/A |
16.52 |
N/A |
14.67 |
N/A |
18.06 |
N/A |
|
Fat (g) |
1.1 |
N/A |
1.71 |
N/A |
0.75 |
N/A |
0.96 |
N/A |
1.08 |
N/A |
|
Carbs (g) |
0 |
N/A |
2.72 |
N/A |
0 |
N/A |
3.57 |
N/A |
0.04 |
N/A |
|
Fiber(g) |
0 |
N/A |
0 |
N/A |
0 |
N/A |
0 |
N/A |
0 |
N/A |
|
Minerals |
||||||||||
|
Ca (mg) |
54 |
5.4 |
59 |
5.9 |
84 |
8.4 |
39 |
3.9 |
89 |
8.9 |
|
Fe (mg) |
3.09 |
18 |
13.4 |
76 |
0.26 |
1.4 |
1.62 |
9 |
0.74 |
4.1 |
|
Mg (mg) |
22 |
5.5 |
18 |
4.5 |
38 |
9.5 |
19 |
4.8 |
34 |
8.5 |
|
P (mg) |
137 |
13.7 |
278 |
27.8 |
161 |
16.1 |
198 |
19.8 |
229 |
22.9 |
|
К (mg) |
113 |
3.2 |
156 |
4.5 |
200 |
5.7 |
46 |
1.3 |
329 |
9.4 |
|
Na (mg) |
566 |
23.6 |
85 |
3.5 |
423 |
17.6 |
56 |
2.3 |
293 |
12.2 |
|
Zn (mg) |
1.56 |
9 |
181.9 |
1,213 |
3.53 |
23.5 |
0.51 |
3.4 |
3.54 |
23.6 |
|
Cu (mg) |
0.19 |
11 |
8.9 |
506 |
1.35 |
67.5 |
0.05 |
2.5 |
0.67 |
33.5 |
|
Mn (mg) |
0.03 |
2 |
0.36 |
18 |
0.06 |
3 |
0.09 |
4.5 |
0.15 |
7.5 |
|
Se (meg) |
29.6 |
42.3 |
19.7 |
28.1 |
63.6 |
90.9 |
30.6 |
43.7 |
37.4 |
53.4 |
|
Vitamins |
||||||||||
|
A (IU) |
180 |
3.6 |
100 |
2 |
4 |
0.08 |
300 |
6 |
5 |
0.1 |
|
B, (mg) |
0.03 |
2 |
0.02 |
1.3 |
0.02 |
1.3 |
0.02 |
1.3 |
0.08 |
5.3 |
|
B,(mg) |
0.03 |
2 |
0.33 |
17 |
0.01 |
0.6 |
0.04 |
2.4 |
0.04 |
2.4 |
|
Bi(mg) |
2.59 |
15 |
2.49 |
14 |
1.59 |
8 |
0.35 |
1.8 |
2.7 |
13.5 |
|
B5 (mg) |
N/A |
N/A |
0.2 |
2 |
1.45 |
14.5 |
0.15 |
1.5 |
0.35 |
3.5 |
|
B6(mg) |
0.16 |
8 |
0.03 |
1.5 |
0.1 |
5 |
0.01 |
0.5 |
0.15 |
7.5 |
|
B,(mcg) |
19 |
4.8 |
7 |
1.8 |
10 |
2.5 |
5 |
1.3 |
44 |
11 |
|
B,,(mcg) |
1.11 |
18.5 |
8.75 |
145.8 |
1.25 |
20.8 |
11.28 |
188 |
9 |
150 |
|
C (mg) |
2 |
3.3 |
0 |
0 |
0 |
0 |
0 |
0 |
3 |
5 |
|
D (IU) |
152 |
38 |
0 |
0 |
1 |
0.3 |
1 |
0.3 |
0 |
0 |
|
E (mg) |
1.32 |
8.8 |
0.85 |
5.7 |
0.87 |
5.8 |
0.68 |
4.5 |
1.84 |
12.3 |
|
К (meg) |
N/A |
N/A |
1 |
1.3 |
0 |
0 |
0.2 |
0.3 |
0.3 |
0.4 |
Aquaculture and Nutrients
Aquaculture tends to yield less-nourishing fish than nature because farm fish eat rapeseed (Brassica napus), wheat (Triticum aestivum), corn (Zea mays), rice (Oryza sativa), soybeans (Glycine max), pulverized feathers, yeast (Saccharomyces cerevisiae), chicken fat, or their combination, the accent being on plant foods rather than multiple trophic levels.43 Farm fish tend to have more fat and thus more calories than wild because fish swim less and eat more in captivity.44 For example, Table 5.3 shows that by mass wild catfish in the same species has more protein, calcium, iron, magnesium, phosphorus, potassium, zinc, manganese, selenium, and vitamins A, B, (thiamine or thiamin), B5 (pantothenic acid), C, and D, less fat, and fewer calories than its farm counterpart.45 This table also compares calories and nutrients in wild and farm salmon.
On the other hand, because aquaculture permits growers to control ponds, the metal mercury and other contaminants should be absent. These pollutants, coming from factories and utilities, caution against eating predators like swordfish (Xiphias gladius), king mackerel (Scomberomorus cavalla), shark (species in the superorder Selachimorpha), orange roughy (Hoplostethus atlanticus), tilefish
TABLE 5.3
Nutrients in Salmon and Catfish Wild versus Farm 100g
|
Nutrient |
Wild Salmon |
%DV |
Farm Salmon |
%DV |
Wild Catfish |
%DV |
Farm Catfish |
%DV |
|
Calories |
42 |
N/A |
208 |
N/A |
95 |
N/A |
119 |
N/A |
|
Protein (g) |
19.84 |
N/A |
29.42 |
N/A |
16.38 |
N/A |
15.23 |
N/A |
|
Fat(g) |
6.34 |
N/A |
13.42 |
N/A |
2.82 |
N/A |
5.94 |
N/A |
|
Carbs (g) |
0 |
N/A |
0 |
N/A |
0 |
N/A |
0 |
N/A |
|
Fiber(g) |
0 |
N/A |
0 |
N/A |
0 |
N/A |
0 |
N/A |
|
Minerals |
||||||||
|
Ca (mg) |
12 |
1.2 |
9 |
0.9 |
14 |
1.4 |
8 |
0.8 |
|
Fe (mg) |
0.80 |
4.4 |
0.34 |
1.9 |
0.3 |
1.7 |
0.23 |
1.3 |
|
Mg (mg) |
29 |
7.3 |
27 |
6.8 |
23 |
5.8 |
19 |
4.8 |
|
P (mg) |
200 |
20 |
240 |
24 |
209 |
20.9 |
204 |
20.4 |
|
К (mg) |
490 |
14 |
363 |
10.4 |
358 |
10.2 |
302 |
8.6 |
|
Na (mg) |
44 |
1.8 |
59 |
2.5 |
43 |
1.8 |
98 |
4.1 |
|
Zn (mg) |
0.64 |
4.3 |
0.36 |
2.4 |
0.51 |
3.4 |
0.48 |
3.2 |
|
Cu (mg) |
0.25 |
12.5 |
0.05 |
2.5 |
0.03 |
1.5 |
0.03 |
1.5 |
|
Mn (mg) |
0.02 |
1 |
0.01 |
0.5 |
0.03 |
1.5 |
0.02 |
1 |
|
Se (meg) |
36.5 |
52.1 |
24.0 |
34.3 |
12.6 |
18 |
8.2 |
11.7 |
|
Vitamins |
||||||||
|
A (IU) |
40 |
0.8 |
193 |
3.9 |
50 |
1 |
1 |
0.02 |
|
B,(mg) |
0.23 |
15.3 |
0.21 |
14 |
0.21 |
14 |
0.02 |
1.3 |
|
B,(mg) |
0.38 |
22.4 |
0.16 |
9.4 |
0.07 |
4.1 |
0.08 |
4.7 |
|
B.^mg) |
7.86 |
39.3 |
8.67 |
43.4 |
1.91 |
9.6 |
2.11 |
10.6 |
|
B5 (mg) |
1.66 |
16.6 |
1.55 |
15.5 |
0.77 |
7.7 |
0.67 |
6.7 |
|
B„(mg) |
0.82 |
41 |
0.64 |
32 |
0.12 |
6 |
0.15 |
7.5 |
|
B,(mcg) |
25 |
6.3 |
26 |
6.5 |
10 |
2.5 |
10 |
2.5 |
|
В |, (meg) |
3.18 |
53 |
3.23 |
53.8 |
2.23 |
37.2 |
2.88 |
48 |
|
C (mg) |
0 |
0 |
3.69 |
6.5 |
0.7 |
1.2 |
0 |
0 |
|
D (IU) |
361 |
90.3 |
441 |
110.3 |
500 |
125 |
9 |
2.3 |
|
E (mg) |
0.73 |
4.9 |
3.55 |
23.7 |
NA |
NA |
0.81 |
5.4 |
|
К (meg) |
0.1 |
0.1 |
0.5 |
0.6 |
NA |
NA |
2.1 |
2.6 |
(Lopholatilus species), and bigeye tuna (Thunnus obesus).46 Carp (Cyprinus carpio), catfish, trout (species in genera Oncorhynchus, Salmo, and Salvelinus), and perch (Perea fluviatilis, P. schrenkii, and P. flavescens) from ponds and streams also tend to have toxins. The attempt to balance seafood’s benefits and perils leaves consumers unsure what to eat, how much, and how often.47
History and Opinions about Aquaculture
The Egyptians invented aquaculture about 2500 BCE, from where it spread west through North Africa.48 Before 1000 BCE, China was farming fish to feed its people.49 Around 600 BCE, Celts in Gaul (today France, Belgium, and Luxembourg) began raising mollusks.50 Aquaculture persisted in Europe, which in the 1960s farmed trout and salmon. Farm fish increased from under 4 percent of the total harvest by mass in 1970 to nearly 52 percent in 2005.51 No livestock sector grew as much during these years.
Critics deem farm fish unnourishing, insipid, and sometimes full of antibiotics, hormones, and pesticides. Hazards are greatest w'here governments do not regulate production. In a global economy, consumers cannot always determine whether fish comes from farm or the w'ild. In the case of farm fish, labels do not always disclose country of origin. Proponents like FAO and the World Health Organization (WHO) in Geneva, Switzerland hope that aquaculture will make fish abundant enough to afford the poor animal protein, an urgent need in Africa and Asia.52 Unlike many plants, animals supply protein with all essential amino acids, noted Chapter 2.
Fish Consumption and Longevity
Chapter 4 compared longevity among countries with the greatest per capita meat consumption. Applying this procedure here, China has the highest per person fish consumption but in 2018 ranked 111th in life expectancy at birth (e°) at 75.7 years.53 Myanmar and Vietnam, ranking second and third in fish consumption, trailed China’s e°. The fourth largest per person consumer, Japan, ranked second in e° at 85.5 years. Tokyo’s National Centre for Global Health and Medicine credits Japanese longevity to consumption of fish, rice and other whole grains, soy foods, vegetables, and fruits.54 Monaco’s residents had the highest e° at 89.4years and eat seafood, cod being popular.55 Singapore ranked third, trailing Japan by under two months.56 Singaporeans eat lobster, oysters, swordfish, cod, salmon, scallops, mussels, and clams.57
China, Myanmar, and Vietnam prove that seafood cannot be longevity’s sole determinant. Chapter 1 indicated that many factors influence lifespan. Seeking clarity unavailable in the above e°s, the remainder of this chapter examines seafood’s healthfulness throughout history.

