Ducks
Most domestic ducks descended from the mallard, which colonized the world’s wetlands. An earlier section stated that northern Europeans hunted waterfowl from an early date. Widespread enthusiasm for ducks spurred domestication in several areas. Asia, notably China, Vietnam, Indonesia, Thailand, Myanmar, the Philippines, and Bangladesh, has roughly three-quarters of domestic ducks.80
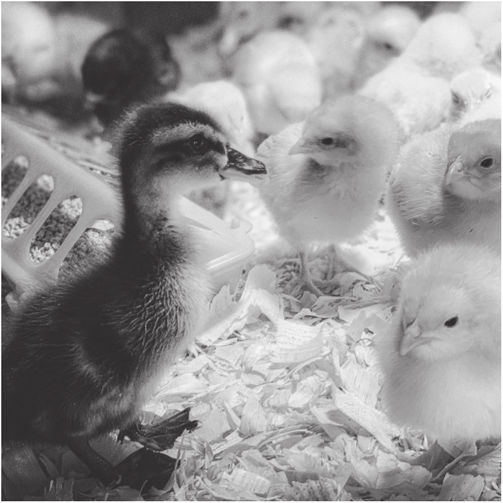
FIGURE 6.5 Ducklings and chicks. (Photo courtesy of Jessica Vierling-West.)
These birds benefited Asia’s rice (Oryza sativa) growers. Whole grain rice (see Chapter 12) supplies starch, minerals, and vitamins but has little fat and lacks some essential amino acids. Ducks complemented the grass by furnishing abundant fat, as noted, and complete protein. Fat and calories made ducks valuable in premodern times when food was more often scarce than plentiful. A supply of complete protein was crucial to peoples who seldom afforded meat. Moreover, ducks thrived better than chickens in rice paddies, eating juvenile crabs (species in the infraorder Brachyura) and locusts (species in the order Orthoptera), both rice pests.81 Suited to this environment, ducks laid more eggs than chickens, supplying more food. Rapid growth permitted slaughter and consumption at six or seven weeks.82
Chinese depictions of ducks dated about 2500 BCE.83 Although possibly not that early, domestication occurred no later than the Warring States period (475-221 BCE) according to contemporary texts. Chinese south of the Yangtze River took the lead in taming various breeds. On the river, Jiangsu province along the Pacific coast was active in this endeavor. Regions near or in the tropics were best for duck keeping and taming because warmth favored hatchlings’ survival. Among Chinese breeds, Peking duck is known worldwide.
Outside China, Egypt may have domesticated ducks, though interest lay with chickens, geese, and pigeons more than ducks. Greek botanist and philosopher Theophrastus (c. 371-c. 287 BCE) mentioned domestic ducks, though they may have been minor in Greek and Roman diets.84 Like chickens, Romans force fed ducks, a practice that improved flavor and raised prices, reserving them for elites. Roman agriculturist Lucius Junius Moderatus Columella (4-70 CE) lamented that ducks were more expensive to raise than geese.
In the fourth century, Brits and Dutch ate wild ducks.85 The Saxons who settled Britain between the fifth and seventh centuries may have kept ducks. Between the eighth and tenth centuries, the French kept fewer ducks than chickens and geese.86 Germans likewise preferred chickens and geese over ducks. Medieval Europe appears to have tamed ducks in response to overhunting wild populations. After roughly 1500, duck bones became more numerous in middens, indicating increases in consumption. Enlargement of ducks in the eighteenth and nineteenth centuries evinced selective breeding. During these centuries, Europeans concentrated on breeds that laid many eggs, rapidly reached sizes suitable for slaughter, or both.
Turning to the western hemisphere, U.S. interest in ducks quickened in 1873 upon importation of the white pekin breed from China.87 The most numerous duck in the United States, it matured to slaughter size fastest, laid numerous eggs, and tolerated confinement well. Small farmers tended to favor Rouen or Muscovy because it foraged better than white pekin. A Brazilian import, Muscovy was the only widespread commercial variety not descended from mallards. Hobbyists often kept bantam (small) breeds, including white or gray calls, black east indies, wood ducks, mandarins, and teals. In the United States, the leading duck producers are Indiana, California, New York, Wisconsin, and Pennsylvania.88
Poultry, Thailand, Vietnam, and Health
An earlier section named Thailand as chickens’ probable cradle. Australian archaeologist and anthropologist Marc F. Oxenham, Vietnamese archaeologist Nguyen Lan Cuong, and Vietnamese biologist Nguyen Kim Thuy identified chicken bones—implying consumption and dating from roughly 2100 BCE to 200 CE—in Thai villages Ban Chiang, Nong Nor. Ban Lum Khao, Ban Na Di, and Noen U-Loke.89 To chickens, American anthropologist Christopher A. King and American archaeologist Lynette Norr added wild birds, naming no species, in their study of Ban Chiang.90 If Thailand’s countryside today illuminates prehistory, villagers kept chickens more for eggs than flesh.91 Other foods included fish, game, beef, rice, millet (species in Eragrostideae tribe), yams (Dioscorea species), and wild plants.92 Between roughly 2100 BCE and 200 CE, these villagers likely increased consumption of carnivores. This class might have included birds that targeted only insects and other animals, though chickens and ducks tend toward omnivory rather than specialization.
Researchers—including Australian anthropologist Kathryn M. Domett in her 2001 study of four prehistoric Thai villages discussed later—mentioned no duck bones as biofacts. Readers might recall that bird bones, being light and hollow, preserve less than sturdy remains and posit this reason for duck bones’ absence. Such thinking, however, should also apply to chicken bones, which are extant.
Lack of duck bones is puzzling given the probability that early Thais ate ducks. Chapter 12 remarks that Thailand acquired rice about 3500 BCE, and the previous section noted that paddies provided an environment better for ducks than chickens.93 It would seem peculiar that, in an era of food insecurity, hungry Thais ate chickens but not ducks. Moreover, because rice cultivation characterized Thailand, Southeast Asia in general, southern China, and South Asia, duck consumption was widespread, as the previous section noted. This section therefore treats chickens and ducks as part of Thai diets such that examination of health illuminates both birds’ contributions to it.
Oxenham, Cuong, and Thuy grouped skeletons, in Table 6.4, by age from the above Thai villages with those from Khok Phanom Di in Chachoengsao province, Thailand, and Non Nok Tha in Khon Kaen province, Thailand, and from three Vietnamese sites.94 Absent from their discussion is information about deaths before age fifteen, a decision that excluded most if not all prepubescents. Childhood’s rapid growth demands calories and nutrients such that juvenile skeletons and teeth tend to register deficiencies more than adult ones. Other chapters emphasize that pathologies may stem from dietary inadequacies, pathogens, parasites, or their combination. To be sure, skeletons and their provenance may supply little information or juvenile skeletons may be scarce. Nonetheless, youth skeletons’ omission excludes data.
Obviously, juveniles’ absence precludes calculation of infant and childhood mortality. Estimation, however, is possible given American ecologist and limnologist Edward Smith Deevey Jr.’s (1914— 1988) generalization—see below and Chapters 1 and 3—that between Neanderthal prehistory and roughly 1900 CE half of all deaths occurred before puberty.95 This magnitude agrees with Domett and New Zealand anthropologist Nancy Tayles’ computation of 46 percent juvenile mortality in Ban Lum Khao and 44 percent in Noen U-Loke between roughly 500 BCE and 300 CE.96 Beyond these figures, Domett computed, in Table 6.5, mortality before age fifteen at 55.8 percent, using 154 skeletons of villagers at Khok Phanom Di, occupied between roughly 2000 and 1500 BCE.97 Of these deaths, 73.3 percent occurred during life’s first year. Ban Na Di, whose seventy-eight skeletons dated between 600 and 400 BCE, totaled 35.9 percent mortality before age fifteen.98 The lowest juvenile death rate came from Nong Nor, inhabited between 1100 and 700 BCE, at 21.3 percent, though 155 skeletons’ poor preservation implies that youth bones deteriorated, reducing the appearance of childhood mortality below' the true percentage 99
This mortality contextualizes and deepens Oxenham, Cuong, and Thuy’s study. For example, they examined 142 skeletons from Ban Chiang, not specifying whether the total included juveniles and adults.100 If both and if Deevey may be taken as a guide, seventy-one should have perished before age fifteen, the threshold year in the authors’ tabulation, and the other seventy-one afterward.
TABLE 6.4
% Deaths by Age in Thailand and Vietnam from Oxenham Cuong and Thuy
|
Place |
Date |
15-19 yr |
20-29 yr |
30-39 yr |
40+ yr |
|
Da But, Vietnam |
c. 4000-c. 3500 BCE |
11.7 |
18.2 |
28.6 |
41.6 |
|
Khok Phanom Di, Thailand |
C.2000-C. 1500 BCE |
11.8 |
33.8 |
36.8 |
17.6 |
|
Early Non Nok Tha, Thailand |
c. 2800-c. 1400 BCE |
5.1 |
17.9 |
25.6 |
51.3 |
|
Early Ban Chiang, Thailand |
C.2100-C. 900 BCE |
6.9 |
20.7 |
20.7 |
51.7 |
|
Late Non Nok Tha, Thailand |
c. 1400-c. 200 BCE |
2.4 |
14.3 |
35.7 |
47.6 |
|
Nong Nor, Thailand |
c. 1100-c, 700 BCE |
2.4 |
30.6 |
50.6 |
16.5 |
|
Ban Lum Khao, Thailand |
c. 1000-c, 500 BCE |
8.5 |
42.4 |
28.8 |
20.3 |
|
Late Ban Chiang, Thailand |
c. 900 BCE-c. 200 CE |
15.2 |
18.2 |
33.3 |
33.3 |
|
Ban Na Di. Thailand |
c. 600-c. 400 BCE |
0.0 |
36.1 |
36.1 |
27.8 |
|
Ma, Ca, Vietnam |
c. 500 BCE-c. 300 CE |
11.9 |
38.1 |
23.8 |
26.2 |
|
Noen U-Loke, Thailand |
c. 300 BCE-c. 300 CE |
7.4 |
44.4 |
25.9 |
22.2 |
|
Red River, Vietnam |
c. 200 BCE-c. 300 CE |
13.6 |
36.4 |
27.3 |
22.7 |
TABLE 6.5
Age at Death in Thailand from Domett
|
SE Thailand |
9 |
% |
SE Thailand |
9 |
% |
NE Thailand |
9 |
% |
NE Thailand |
9 |
% |
|
Khok Phanom Di c. 2000-c. 1500 BCE |
Nong Nor c. 1100-c. 700 BCE |
Ban Lum Kliao c. 1000-c. 500 BCE |
Ban Na Di c. 600-c. 400 BCE |
||||||||
|
<1 yr |
63 |
40.9 |
17 |
10.9 |
21 |
19.1 |
15 |
19.2 |
|||
|
-b |
II |
7.1 |
6 |
3.9 |
14 |
12.8 |
8 |
10.3 |
|||
|
5-9 |
7 |
4.5 |
4 |
2.6 |
11 |
10 |
2 |
2.6 |
|||
|
10-14 |
5 |
3.3 |
6 |
3.9 |
5 |
4.5 |
3 |
3.8 |
|||
|
Youths |
86 |
55.8 |
33 |
21.3 |
51 |
46.4 |
28 |
35.9 |
|||
|
15-19 |
8 |
5.2 |
2 |
1.3 |
5 |
4.5 |
0 |
0 |
|||
|
20-29 |
23 |
14.9 |
26 |
16.8 |
25 |
22.7 |
13 |
16.7 |
|||
|
30-39 |
27 |
17.5 |
43 |
27.7 |
17 |
15.5 |
13 |
16.7 |
|||
|
>40 |
10 |
6.5 |
14 |
9 |
12 |
10.9 |
10 |
12.8 |
|||
|
Adults |
68 |
44.2 |
85 |
72 |
59 |
53.6 |
36 |
64.1 |
|||
|
Total |
154 |
100 |
118 |
100 |
110 |
100 |
64 |
100 |
|||
|
Unknown |
0 |
37 |
0 |
14 |
Referencing only adults, Oxenham, Cuong, and Thuy determined that before around 900 BCE, 51.7 percent of Ban Chiang’s residents reached age forty, a figure that declined to one-third afterward.101 But, assuming that the skeletons represented both youths and adults, and noting that these authors considered only adults, only roughly half (about seventy-one skeletons) should have been adults. Inclusion of juveniles doubles the population, halving the proportion that reached any age, Table 6.6 indicates. That is, before about 900 BCE, roughly one-quarter of Ban Chiang’s occupants reached age forty. Afterward the percentage fell to only around 16.7. Domett and Tayles conceded as much, characterizing the fifth decade as “old age.”102
In this light, Ban Chiang looks like medieval Europe (see Chapter 3), where age forty marked life’s end.103 The village confirms French anthropologist and paleontologist Henri Victor Vallois’ (1889— 1981) lament, quoted in Chapter 3, that “few individuals passed forty years, and it is only quite exceptionally that any passed fifty.”104 Domett repeated some of this language almost verbatim, noting that “Few individuals survived beyond 40years in each of the samples.”105 Although some demographers and anthropologists, referenced in Chapter 3, dispute this conclusion, studies of skeletons from natives, Africans, and whites in the Americas reveal that before roughly 1900, few surpassed age forty-five.106
Of the other sites and employing the same method for calculating survival to forty, the approximate figures are one-quarter of inhabitants in Non Nok Tha, one-fifth in Da But in Vihn Loc district, Vietnam, 13 percent in Ban Na Di and a settlement along Vietnam’s Ma River, one-tenth in Ban Lum Khao, Noen U-Loke, and a village along Vietnam’s Red River, and 8 percent in Khok Phanom Di and Nong Nor.107 My numbers may be compared with Domett’s computation of survival to age forty at 12.8 percent for Ban Na Di, at 10.9 percent for Ban Lum Khao, 9 percent for Nong Nor, and 6.5 percent for Khok Phanom Di.108 Overall, Domett’s calculations of survivorship to forty are no bleaker than mine. That said, lifespan appears to have been greatest in early Ban Chiang and Non Nok Tha. Oxenham, Cuong, and Thuy’s age distribution for adults reveals that mortality rose around age twenty and remained high thereafter.109 This distribution and high prepubescent mortality imply that ages fifteen through nineteen were the only years comparatively free from death.
Yet these numbers reveal little about eggs, chickens, and ducks’ contributions to health. Domett identified chicken bones at both southeastern villages, Khok Phanom Di and Nong Nor, but at neither in the northeast, Ban Lum Khao and Ban Na Di.110 This division should have permitted contrasts
TABLE 6.6
Revised % Deaths by Age in Thailand and Vietnam
|
Place |
<15 yr |
15-19 yr |
20-29 yr |
30-39 yr |
40+ yr |
|
Da But |
50 |
5.8 |
9.1 |
14.3 |
20.3 |
|
Khok Phanom Di |
55.8 |
5.2 |
14.9 |
17.5 |
6.5 |
|
Early Non Nok Tha |
50 |
2.55 |
9 |
12.8 |
25.65 |
|
Early Ban Chiang |
50 |
3.45 |
10.4 |
10.4 |
25.85 |
|
Late Non Nok Tha |
50 |
1.2 |
7.15 |
17.85 |
23.8 |
|
Nong Nor |
28 |
1.3 |
16.8 |
27.7 |
9 |
|
Ban Lum Khao |
46.4 |
4.5 |
22.7 |
15.5 |
10.9 |
|
Late Ban Chiang |
50 |
c. 7.6 |
c. 9.1 |
c. 16.65 |
16.65 |
|
Ban Na Di |
35.9 |
0 |
16.7 |
16.7 |
12.8 |
|
Ma, Ca |
50 |
5.95 |
19.05 |
11.9 |
13.1 |
|
Noen U-Loke |
50 |
3.7 |
22.2 |
13 |
11.1 |
|
Red River |
50 |
6.8 |
18.2 |
13.65 |
11.35 |
between southeast and northeast, but the differences were temporal rather than geographic. That is, health—as measured by longevity, height, and enamel hypoplasia (all defined in Chapter 1)—improved over time not space.111 The earliest village, Khok Phanom Di, displayed the worst health. Bronze Age Nong Nor and Ban Lum Khao (c. 1400 BCE) were intermediate, and Iron Age Ban Na Di (600-400 BCE) exhibited the best outcomes. Were diet a factor, the later sites may have been healthier because food supply was more dependable, or storage places held larger reserves to cover fluctuations in supply.

