Interpretation of Soil Properties
A number of suggestions have been made for using SPT results to predict individual soil properties. The SPT has applications in a wide range of soils; however, correlations between the test results and soil properties can be divided into either coarse-grained or fine-grained soils. In the following sections, methods to predict soil properties are presented. Because of unknown SPT practices and differences in SPT energies used up to the 1980s when many original SPT correlations were developed and the present day (2020) energies, there is the potential for considerable error in many of the empirical correlations. In general, because current energy levels are typically higher than those of the 1950s, the results generally lead to conservative estimates of soil properties using older correlations. The best correlations are generally those that use N60 in fine-grained soils and (N1)
SPT in Coarse-Grained Soils
Relative Density
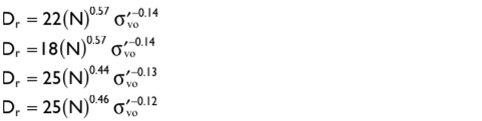
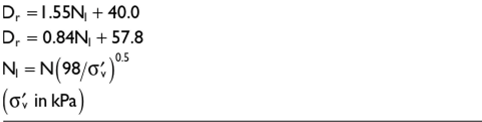
A number of early correlations of SPT N-values and relative density, Dr, of coarse-grained soils were presented at a time when either donut or safety hammer were used to perform the SPT. Differences in these correlations are related to variations in the composition, geologic origin, stress history, and moisture conditions of coarse-grained soils and the procedures and equipment used. For example, the correlation given by Gibbs & Holtz (1957) used a spoon with a constant internal diameter and no relief. Therefore, the blow counts may be higher than those obtained if a spoon with an internal relief had been used. A number of correlations developed after 1975 are summarized in Table 2.6.
It is clear that no single expression can be used to describe the relationship between SPT blow counts and relative density for all sands considering differences in grain-size distribution, age, stress history, geologic origin, etc., and differences in field practices used to obtain N-values. Cubrinovski & Ishihara (2001) suggested an approach for estimating relative density from N-values accounting for gradation as characterized by the void ratio difference (emax-emin). A compilation of several correlations using energy and stress-corrected blow counts, (N1)60, is presented in Figure 2.10.
Table 2.6 Some reported correlations between N and relative density, Dr
|
Correlation |
Notes |
References |

|
Fine sand n’v0 in Psi |
Marcuson & Beiganousky (1977a) |

|
Coarse sand n’v0 in Psi |
Marcuson & Beiganousky (1977b) |

|
NC o’vo in psi |
Marcuson (1978) |

|
Borowczyk & Frankowski (1981) |
|

|
o’vo in metric tons/m2 |
|

|
Clean sands o’vo in kg/cm2 or tsf Sands with fines |
Tokimatsu & Yoshimi (1983) |

|
||

|
Dr>0.35 |
Skempton (1986) |

|
a’vo = 0.5 to 1.5 kg/cm2 Dr = 0.4 to 0.9 |
Skempton (1986) |
|
Fine sand Gravel content 25% Gravel content 50% All soils a’vo in kPa |
Yoshida et al. (1988) |

|
Normally consolidated, unaged sands |
Kulhawy & Mayne (1990) |
|
0 |
Hatanaka & Feng (2006) |

Figure 2.10 Correlation between SPT (N|)60and relative density. (From NHI 2002.)
Friction Angle
The results of the SPT may be useful in estimating the shear strength of granular soils by providing an estimate of the drained friction angle, tp'. It should be recognized that the value of cp' is not unique but depends on stress level, stress path, loading conditions, etc., and therefore, any estimate does not take these factors into account. A number of suggestions have been proposed by various researchers for evaluating ф' from SPT N-values. Direct correlations between N and ф' have been presented and are summarized in Table 2.7. In most cases, the reference values for ф' have not been given.
Table 2.7 Reported correlations between N and фТог coarse-grained soils
|
Correlation |
References |

|
Meyerhof (1956) |

|
Kishida (1967) |

|
Muromachi et al. (1974) |

|
Parry (1977) |

|
|

|
Shioi & Fukui (1982) |

|
Kulhawy & Mayne (1990) |

|
Bergado et al. (1993) |

|
Hatanaka & Uchida (1996) |

|
|

|

Figure 2.11 Correlation between (N,)60 and tp'. (From NHI 2002.)
Figure 2.11 shows a comparison between SPT (N,)60 values and cp'values obtained from triaxial compression tests. This correlation appears to be in popular use and is given in a number of FHWA manuals.
Engineers should use caution when estimating the friction angle in sands from N values. Local experience with foundation performance should be used to corroborate any correlations.
Soil Elastic Modulus
The stiffness of granular soils, represented by the drained elastic Young’s Modulus, E, or constrained modulus, M, is also a function of the mean effective stress level for a constant void ratio such that the variation in modulus with depth will be similar to the increase in N; i.e., in a uniform deposit at constant void ratio, soil modulus increases with depth. Therefore, with stiffness, we should look for a relationship with uncorrected N60 values. In this way, the increase in N with depth in the uniform relative density deposit will reflect an increase in stiffness with depth.
Numerous suggestions have been made to use the SPT for estimating the elastic modulus, Es, of granular soils. Although a number of different equations have been used, most of these correlations have the general form of

where
Es = soil modulus
N = SPT blow counts
a and b = constants (empirical factors)
Suggested correlations between N and Es are presented in Table 2.8.
Table 2.8 Some reported expressions for soil modulus from N.
|
Correlation |
Soil type |
References |
|
Es (tsf) = 5 (N + 15) |
Sand |
Webb (1969) |
|
Es (tsf) = 10/3 (N + 5) |
Clayey sand |
|
|
Es (MPa) = 7 (N)05 |
Sand |
Denver (1982) |
|
Es (MPa) = 3.5N to 40N |
Sand |
Clayton et al. (1985) |
|
Es (MPa) = 2.22N0888 |
Partially saturated gravels |
Wrench & Nowatzki (1986) |
|
Es (kPa) = 1200 (N + 6) |
Gravelly sand and gravel |
Bowles (1988) |
|
Es (kPa) = 600 (N + 6) |
||
|
N<15 |
||
|
Es (kPa) = 600 (N + 6) + 2000 |
||
|
N>15 |
||
|
Es (kPa) = 320 (N+ 15) |
Clayey sand |
Bowles (1988) |
|
Es (kPa)= 300 (N + 6) |
Silty sand |
Bowles (1988) |
|
Es (MPa) = 1.6N |
Residual |
Jones & Rust (1989) |
|
Es (MPa) = 7.5 + 0.8N |
Sand |
Papadopoulos (1992) |
|
Es (MPA) = 2.5N60 |
Saprolite |
Decourt (1994) |

