Constrained Modulus
Other attempts have been made to correlate the results of the SPT to the constrained modulus of the soil (M) as a function of overburden stress (e.g., Schultze & Melzer 1965; D’Appolonia et al. 1970). Since the constrained modulus, M, is related to the elastic Young’s modulus, Et, as

an estimate of Poisson’s ratio is required to estimate Es from M. For most granular soils in drained loading conditions, the constrained modulus generally varies in the range of 1.2ES-1.5ES.
There is considerable scatter in suggested correlations between soil stiffness or modulus and SPT blow counts. Wroth (1984) considered correlations between N and soil compressibility as “secondary” and dependent on the relationship between strength and stiffness of granular soils. Since soil modulus is strain level-dependent, the correlations include comparisons at a range of strain levels.
Small-Strain Shear Modulus
The shear modulus of soils is also strain level-dependent and reaches a maximum value at strain levels in the order of 10-4%. The value at small strains is often referred to as G0 or Gmax and in recent years, it has become customary to use this value as a reference point. The value of Gmax is often obtained from dynamic measurements, which produce small dynamic strains, by measuring the dynamic shear wave velocity, Vs. The shear modulus, Gmax, may then be obtained as

where
Gmax = shear modulus (MPa)
Vs = shear wave velocity (m/s) р = total soil unit weight (kg/m5) g = acceleration of gravity (9.8 m/s2)
Correlations between SPT blow counts and both shear wave velocity, Vs, and Gmax have been suggested by a number of investigators (e.g., Sykora & Koester 1988; Lee 1992; Fabbrocino et al. 2015) and are summarized in Tables 2.9 and 2.10. Most empirical correlations between Vs and N are in the form of

Liquefaction Potential
The SPT has a long history of use for evaluating the liquefaction potential of sites composed predominantly of sands, sands and gravel, and silty sand. A detailed test procedure for performing the test is given in ASTM D6066 Standard Practice for Determining the Normalized Penetration Resistance of Sands for Evaluation of Liquefaction Potential. Seed et al. (1985) had recommended the following SPT procedure for use in liquefaction correlations of coarse-grained soils:
- 1. Borehole 10-15 cm (4-5 in.) diameter; rotary hole with bentonite drilling mud for stability;
- 2. Drill bit - upward deflection of drilling mud (tricone or baffled drag bit);
- 3. Sampler O.D. = 50.8 mm (2.0in.) I.D. = 34.9 mm (1.375 in.) constant, i.e., no room for liners;
- 4. Drill rod A or AW rods for depths less than 15.2 m (50 ft); N or NW rods for depths greater than 15.2m (50ft);
- 5. Energy delivered to sampler 60% theoretical;
- 6. Blow count rate = 30-40 blows/min;
- 7. Penetration resistance Count 0.15-0.46 m (6-18 in.).
While there has been a significant shift in this area of work from the use of the SPT to the use of the CPT, there is still considerable routine work being performed with the SPT.
Based on field performance, Seed et al. (1985), Seed and De Alba (1986) had presented charts representing the relationship between the cyclic stress ratio (CCR) causing liquefaction and (Нг)60 values for clean sands and sand with varying amounts of fines for M = 7.5 earthquakes. Based on field performance, three approximate ranges of liquefaction damage potential could be established as follows:
|
(N,)60 |
Potential damage |
|
0-20 |
High |
|
20-30 |
Intermediate |
|
>30 |
No significant damage |
Figures 2.12 and 2.13 show typical charts for both clean sands and silty sands for earthquake magnitude M = 7.5. Note that the presence of fines increases the CSR needed to cause liquefaction for the same SPT (N,)60 value. Adjustments to CSR have been suggested to account for factors such as high confining stress and nonlevel ground conditions and are available elsewhere (e.g., Kraemer 1996).
Table 2.9 Reported correlations between N and Vs for coarse-grained soils
|
Correlation° |
Soil |
References |
|
Vs = 80.6 (N)0331 |
Alluvial sand |
Imai (1977) |
|
Vs = 97.2 (N)°323 |
Dilluvial sand |
|
|
Vs = 91.0 (N)0 337 |
All |
|
|
Vs = 15 (N) |
Fine sands above water table |
Schmertmann (1978) |
|
Vs = 85 (N)0341 |
All |
Ohta& Goto (1978) |
|
Vs = 88 (N)0340 |
Sands |
|
|
Vs = 75.3 (N)0 351 |
Gravels |
|
|
Vs = 87 (N)0333 |
Clays |
|
|
Vs = 97 (N)0314 |
All |
Imai &Tonouchi (1982) |
|
Vs=56 (N)« |
Sands |
Seed et al. (1983) |
|
Vs= 107 (N)029 |
Granular |
Sykora & Stokoe (1983) |
|
Vs= 61 (N,)W |
Sands & silty sands |
Seed et al. (1985) |
|
Vs = 80 (N)033 |
Alluvial sand |
Towhata & Ronteix (1988) |
|
V$ = 53.5(N60)°17 z°193 fa fG (z = depth (m)) (fa = age factor) Holocene = 1.0 Pleistocene =1.3 (fG = grading factor) Fine sand =1.09 Medium sand =1.07 Coarse sand =1.14 Sand and gravel = 1.45 Gravel = 1.45 |
Sands |
Jamiolkowski et al. (1988) |
|
Vs = 49(Ni)025 |
Fine sand |
Yoshida et al. (1988) |
|
vs = 56(Nl)02bo;-014 |
Gravel content 25% Gravel content 25% |
|
|
Vs = 60(N, Го;.-014 Vs=55(N,ro'J14 (o™ in kPa) |
All |
|
|
Vs= 104.7 (N)0296 |
Sandy soils |
Lee (1992) |
|
Vs = 93.1 (N + I)0329 Vs = 76.2 (N)°°76 (D)03'3 Vs = 86.1 (N)°°75(D+ I)0340 (D = depth in meters) |
Silts |
|
|
Vs = 49.1 (N)0502 |
Noncohesive Greece |
Kalteziotis et al. (1992) |
|
Vs = 90 (N)034 |
Misc. soils from Singapore |
Veijayaratnam et al. (1993) |
|
Vs= 123 (N60)0 286 |
Loose sands and silts |
Raptakis et al. (1994) |
|
Vs= 100 (N60)0237 |
Medium and dense Sands |
|
|
Vs= 192 (N60)0'31 |
Gravelly soil mixtures |
|
|
Vs = 85.3 (N)042 |
Gravelly soils |
Athanasopoulos (1994) |
|
Vs = 55.6 (N)05 |
Sand and rock |
Akino & Sahara (1994) |
|
Vs= 145 (N60)0178 |
Silts and sands |
Pitilakis et al. (1998) |
|
Vs =63 (N60)0 43 Vs= 132 (N60)»32 Vs = 53(N6o)OI,(o;o)0'18 Vs =1 I5(N60)0I7(o;o)0'2 (o;o in kN/m2) |
Holocene gravels Pleistocene gravels Holocene gravels Pleistocene gravels |
Rollins et al. (1998) |
(Continued)
Table 2.9 (Continued) Reported correlations between N and Vs for coarse-grained soils
|
Correlationa |
Soil |
References |
|
Vs= 145 (N)0178 |
Silts |
Pitilakis et al. (1999) |
|
Vs= 132 (N)0271 |
Clays |
|
|
Vs = 22 (N)0770 |
Silts |
Jafari et al. (2002) |
|
Vs = 27 (N)0730 |
Clays |
|
|
Vs= 131 (N60)0 20S |
Sands |
Hasancebi & Ulusay (2007) |
|
Vs= 107.6 (isy0237 |
Clays |
|
|
Vs = 73 (N)0330 |
Sands |
Dikmen (2009) |
|
Vs = 44 (N)0480 |
Clay |
|
|
Vs = 60 (N)0360 |
Silt |
|
|
Vs= 100.5 (N)0265 |
Sands |
Uma Maheswari et al. (2010) |
|
V$ = 79.7 (N60)0365 |
Cands |
Tsiambaos & Sabatakakis (2011) |
|
Vs= 112.2 (N^,)0324 |
Clay |
|
|
Vs = 88.8 (N60)0 370 |
Silt |
|
|
Vs= 107.2 (N)0 34 |
Sands |
Esfehanizadeh et al. (2015) |
|
Vs = 77.1 (N)0355 |
Sands |
Fatehnia et al. (2015) |
|
Vs= 100.3 (N)0 338 |
Sandy |
Kirar et al. (2016) |
|
Vs = 78.7 (N)0352 |
Sand |
Gautam (2017) |
a Vs in m/s.
Table 2.10 Reported correlations between N and Gmax for coarse-grained soils
|
Correlation0 |
Soil |
References |
|
Gmax= 11.5 (N)°78 |
All |
Ohsaki & Iwasaki (1973) |
|
Gm»c = 6.1 (N)»’4 |
Cohesionless |
|
|
Gmax = 5000 (N)83 (Gmax in psf) |
Data from Stokoe & Woods (1972) |
Kovacs (1975) |
|
Gmax = 94 (N)°-715 |
Alluvial sand |
Imai (1977) |
|
Gma,= 170 (N)8«o |
Diluvial sand |
|
|
GTOX= 120 (N)° 737 |
All |
|
|
G^= 14 (N)068 |
All |
Imai & Tonouchi (1982) |
|
Gmax = 6.2 (N) |
Sands |
Seed et al. (1983) |
|
Gmx = 20,000(Ni)0.33(a'vo)°5 (Gmax and 0™ in psf) |
Gravels |
Seed et al. (1985) |
|
Gmax =7 (N) |
Data from Imai & Tonouchi (1982) |
Stroud (1989) |
|
Gmax = ^7.5 (N)»72 |
Lateritic soils |
Decourt (1994) |
|
Gmax=5(N) |
Misc. soils |
Hirayama (1994) |
|
Gmax = 62.8 (N)»3» |
Gneissic residual soil |
Pinto &Abramento (1997) |
|
Gmax = 55.2 (N)066S |
Lateritic soils |
Barros & Pinto (1997) |
|
Gmax = 56+ 20.3 (N) Gmax = 43.8 (N)°-419 Gmax = 94 + 2.3 (N) |
Saprolitic soils |
|
|
Gmax = 98+ 0.42 N60 Gmax =57 (N)02 |
Granitic saprolite |
Viana da Fonseca et al. (1998) |
|
G^ (MN/m2) = 24.3 (N)oss Gmax(MN/m2) = 29.2(N,)“7 |
Mixed soils |
Anbazhagan & Sitharam (2010) |
|
Gmax =I5-I(N|)^q4 |
All soils |
Anbazhagan et al. (2012) |
a G,nJ„ in MPa except as noted.

Figure 2.12 Liquefaction potential based on SPT results for clean sands. (From Seed et al. I98S.)
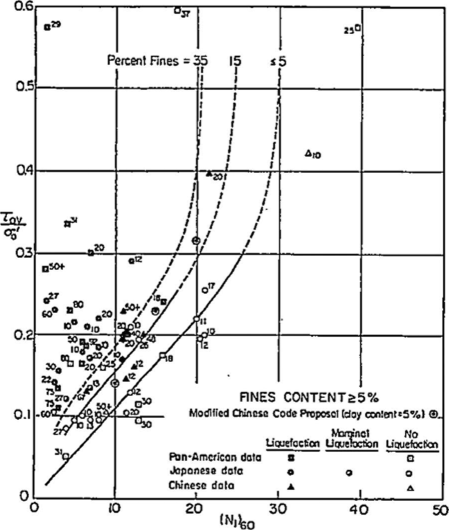
Figure 2.13 Liquefaction potential based on SPT in silty sands. (From Seed et al. I98S.)

