Large Penetration Test
Larger diameter spoons are allowed by ASTM D1586 but are not considered acceptable for determining N-values. Several drill rig manufacturers provide spoons with an outside diameter of 76 mm (3 in.) and an inside barrel diameter of 63.5 mm (2.5 in.). The inside diameter of the shoe is 44.5 mm (1.75 in.). A larger spoon is useful if a larger volume of soil is desired or if gravelly material is present at the site. Because of the difference in spoon sizes, the blow count values obtained with a larger spoon will be different than those obtained with a standard 50.8 mm (2 in.) spoon.
In soil deposits that contain significant amounts of gravel, the penetration resistance of the SPT may be artificially high since gravel particles may not enter the spoon or may get jammed in the shoe. Gravel is usually indicated by poor sample recovery for each SPT. In order to overcome this problem, the use of LPT was introduced. The LPT should not be confused with simply using a larger size spoon and the same SPT hammer. Various configurations of the LPT have been used in Japan (Kaito et al. 1971), Italy (Crova et al. 1993), and Canada (Koester et al. 2000; Daniel et al. 2003). Harrison et al. (2017) also described an LPT used in Canada with a 109 kg (240 lbs) hammer with a drop height of 450 mm (18 in.) and a spoon with an inside diameter of 102 mm (4 in.).
The LPT was apparently introduced by Kaito et al. (1971) for evaluating the liquefaction potential of granular soils with some gravel size particles. The test is performed much in the same way as the SPT but adopts a larger hammer and sampler and a larger fall height. In the Japanese LPT, a 100kg (220 lbs) hammer is used with a fall height of 1.5m (5ft). The sampler has an inside diameter of 50 m (2 in.) and an outside diameter of 73 mm (2.9 in.) and is driven a distance of 30cm (1 ft) to obtain the LPT blow count value, NLPT. A variation of this test has been described by Crova et al. (1993). Table 2.15 presents a comparison between various components of the SPT and different LPTs.
Table 2.15 Comparison between SPT and large penetration tests
|
Drive method |
SPT |
LPT (Japan) |
LPT (Italy) |
LPT (Canada) |
|
Drop hammer |
Drop hammer |
Drop hammer |
Drop hammer |
|
|
Hammer mass (kg) |
63.5 |
100 |
560 |
134 |
|
Drop height (m) |
0.76 |
1.50 |
0.50 |
0.76 |
|
Sampler OD (mm) |
51 |
73 |
140 |
76 |
|
Sampler ID (mm) |
35 |
50 |
100 |
61 |
Most common casing size.
Since there is significant similarity between the SPT and LPT, it should be possible to establish a correlation between the two tests. Tokimatsu (1988) has suggested that provided the energies delivered to the unit surface of the two samplers are the same, the correlation between the two tests should be as follows:

For soils without gravel, this correlation appears to be satisfactory since soil can be ingested into both samplers. However, the ratio tends to become greater than 1.5 for gravelly soils.
Tokimatsu (1988) presented a comparison between N values obtained from the SPT and LPT for different soils. The results shown in Figure 2.30 indicate that the actual ratio NSPX/NLPX varies from about 1.5 to 2.5. Similar results were presented by Yoshida et al. (1988). The use of the LPT was also described by Suzuki et al. (1993) for the investigation of gravelly soil at several sites in Japan. Measured ratios of NSPX/NLPX ranged from 1.0 to 3.5.
The ratio NSPX/N, PX appears to be related to the mean grain size, at least for well-graded soils (e.g., Daniel et al. 2004). The tendency for the ratio to increase with increasing D50 probably reflects the higher SPT blow counts that occur as a result of gravel particles that are too large to enter the split spoon. This might also be reflected in low recovery ratios for the SPT. On the other hand, Crova et al. (1993) showed that on average, the ratio (N1(60)) spx/(N1(60))lpx obtained using an Italian-style LPT was about 1.0 for several sites and also indicated that there appeared to be little or no relationship with D50.
Engineers should consider using a 76 mm (3 in.) O.D. split spoon sampler with conventional SPT equipment when gravelly sands are encountered. It will be necessary to develop local correlations to convert the blow counts obtained to equivalent SPT N-values. Comparisons made by the author using a standard 50.8 mm (2 in.) barrel sampler without liners and a 76 mm (3 in.) sampler (I.D. = 63.5 mm (2.5 in.)) without liners at several sites are presented in Figure 2.31. At each of the sites, the same driller and SPT equipment were used to perform both tests. As can be seen for most of the sites, the ratio of N(3)/N(2) varies from about 1 to 3. Based on the differences in end and side areas, the ratio N(3)/N(2) should be on the order of
1.5. The difference is probably related to the relative contribution of end bearing and side resistance to N for each sampler and each soil.

Figure 2.30 Comparison between N-values obtained from SPT and LPT. (After Tokimatsu 1988.)
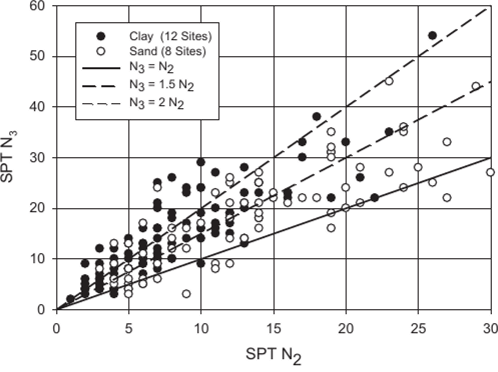
Figure 2.31 Comparison of N-values between 2 and 3 in. spoons.

