Stress History and In Situ Stress
At the present time, there are insufficient reliable results available to accurately predict the in situ lateral stress or stress history of coarse-grained soils from CPT results. A number of calibration chamber tests results available in clean uncemented quartz sands show that there is a unique relationship between the measured tip resistance and the effective horizontal stress, o'h (e.g., Parkin 1988; Houlsby & Hitchman 1988). While it is well known that the prepenetration state of stresses largely controls the response obtained from the CPT in sands, it is not a simple matter to extract the magnitude of in situ lateral stresses from cone data.
Elastic Modulus
The elastic modulus, Es, of soils has also been correlated to the results of tip resistance measurements (qc) obtained from the CPT. Most early correlations between qc and Es were of the general form


Figure 4.26 Updated correlation between normalized CPT tip resistance and friction angle. (From Mayne 2014.)
where
X = a constant (empirical factor)
Mitchell & Gardner (1975) compiled a large number of reported correlations, which generally show very wide scatter. Table 4.4 summarizes a number of suggestions for estimating soil modulus from CPT.
Es in units of qc for CPT
The use of large calibration chamber tests on reconstituted samples of sands has helped to evaluate variables that can influence correlations between soil modulus and CPT results.
Table 4.4 Some reported correlations between Es and qc in sands
|
Correlation |
Soil |
References |
|
Es = 2.9 qc |
Sand |
Garga & Quin (1974) |
|
Es = aqc 1 < a < 4 |
NC and OC sand |
Dahlberg (1974) |
|
Es= II qc |
Sand |
Lambrechts & Leonards (1978) |
|
ES = 2.5 qc |
Axisymmetric loading |
Schmertmann et al. (1978) |
|
Es = 3-5 qc |
Plain strain loading |
|
|
Es = 2.5 qc |
Sand |
Roth et al. (1982) |
|
Es = a qc a = 1.7-4.4 Average = 2.5 |
Medium sand |
Das Neves (1982) |
|
Es = 8(qc)05 qc in MPa |
Sand |
Denver (1982) |
|
Es = 2-4 qc |
Sand (normally consolidated) |
Bowles (1988) |
|
Es=(l + D?)qc Es = 6-30 qc |
Sand (overconsolidated) |
|
|
Es = 3-6 qc |
Clayey sand |
|
|
Es = 1-2 qe |
Silty sand |
Es in units of qc for CPT.
For a given sand, the ratio E/qc is related to stress history and current stress level for sands at different relative densities. Robertson (1991) proposed that the ratio of Es/qc should be expressed as a function of the relative load intensity.
Because of the wide range in correlation constants that may exist between the results of in situ penetration tests and a singular value of soil modulus, it is doubtful that any method that relies on these techniques for the accuracy of settlement estimates will be of much value, other than those created by local correlations developed from full-scale field observations of performance.
Constrained Modulus
In one-dimensional compression, the tangent slope of the stress-strain curve is defined as the constrained modulus:

From elastic theory, the constrained modulus is related to the Young’s modulus and shear modulus as

Based on a series of calibration chamber tests on a dry medium to fine quartz sand, Chapman & Donald (1981) found that the initial one-dimensional constrained modulus, M, could be related to qc. For normally consolidated conditions: the expression M = 3qc provided a lower bound, with most data falling in the range M = 3-4 qc. For overconsolidated specimens (with OCR < 2), the results indicated iM = 8-15 qc with an average value of M = 12 qc.
For a given sand, the ratio M/qc is related to stress history and current stress level for sands at different relative densities. For both normally consolidated and overconsolidated sands, the ratio M/qc decreases with increasing relative density, all other factors being equal. Mayne (2006) presented a compilation of test results showing a correlation between D and net tip resistance as

The value of a'. = 5 for soft to firm clays and normally consolidated sands. The global correlation between M and CPTU net tip resistance for a wide range of soils is shown in Figure 4.27.
Shear Wave Velocity and Small-Strain Shear Modulus
The small-strain shear modulus in soils may be measured using a number of field crosshole and downhole methods that are more or less considered standard techniques for dynamic testing. The shear wave velocity may also be measured directly using a seismic cone or piezocone (SCPT/SCPTU) as illustrated in Figure 4.28.
Estimates of either Vs or Gmax may be obtained indirectly from CPT results through empirical correlations. Gmax is obtained from Vs as

where
p = soil density

Figure 4.27 Correlation between constrained modulus and net CPTU tip resistance. (From Mayne 2006.)
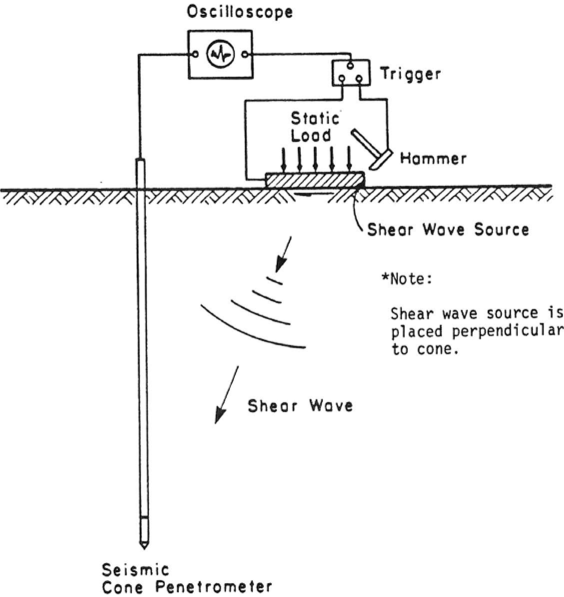
Figure 4.28 Schematic of seismic CPT/CPTU.
Shear Wave Velocity and Shear Modulus from qc
Estimates of Vs and Gmax in different coarse-grained soils have been suggested. Table 4.5 gives a number of reported empirical correlations. Several studies have also shown that the results of cone tests may be used to make direct estimates of Gmax in coarse-grained soils. Robertson (1990) suggested a generalized approach relating Gmax to normalized tip resistance that appears to be useful for estimating Gmax for a wide range of soils, as shown in Figure 4.29. A similar correlation is given in Figure 4.30.
Liquefaction Potential
For over 40 years, the CPT/CPTU has been used to evaluate liquefaction potential of coarsegrained soils (Robertson &c Campanella 1985; Robertson &c Wride 1995; Stark &c Olson 1995; Idriss & Boulanger 2004; Moss et al. 2006; Juang et al. 2008). The methods generally are based on cone tip resistance, qc or qt, or on direct or indirect measurement of shear wave velocity (Kayabali 1996; Andrus et al. 2004). More recently, methods have also been presented incorporating CPT/CPTU friction ratio (e.g., Mola-Abasi et al. 2018). The methods are similar to approaches that use SPT N-values discussed in Chapter 2.
In general, the available methods make use of databases of CPT/CPTU results obtained at sites that experienced liquefaction and separate them from sites that did not experience liquefaction for the same seismic event. Methods are typically for earthquake with magnitude 7.5 and are based on a plot of cyclic stress ratio (CSR) that causes liquefaction and normalized cone tip resistance, as shown in Figure 4.31 for clean sands and Figure 4.32 for silty sands. The normalized tip resistance is obtained as

Table 4.5 Some reported empirical correlations between Vs and qc for coarse-grained soils
|
Correlation |
References |
|
Vs = 134.1 +0.0052qc |
Sykora & Stokoe (1983) |
|
Vs = 277 qt O,0 (qt in MPa) |
Baldi et al. (1989) |
|
Vs = 13.18 q?'1’2Ото179 (4.25a) Vs =12.02 q?3l,fs-° |
Hegazy & Mayne (1995) |
|
Vs = 25.3 q? l63fs002,D° l5S |
Piratheepan (2002) |
|
Vs= 118.8 log(fs)+ 18.5 |
Mayne (2006) |
|
Gmax =1634 q"zi0O™J,i |
Rix& Stokoe (1991) |
|
Gmix = 2-26 qc + 59.2 (GMX & qc in MPa) |
Fiorovante et al. (1991) |
|
Gmax = 50 qc°b |
Anagnostopoulos et al. (2003) |
|
олп ,-0.2!>0 —/0.37S Gmax = 800 qc Ovo (upper bound: cemented) Gmax = 280 qc 0,0 (lower bound: cemented) (upper bound: uncemented) Gmax — 110 qc 0,0 (lower bound: uncemented) |
Schnaid et al. (200) |
|
Gmax = 50pa[(qt - O,0/pa)]°6 |
Mayne (2006) |
Vs in m/s; qc, fs, and CTV0 in kPa; D = depth in m; GmJ1( in MPa.

Figure 4.29 Correlation between Gmax and CPT qc. (After Robertson 1990.)

Figure 4.30 Small strain shear modulus related to net CPTU tip resistance. (From Mayne 2006.)
where
pa = atmospheric pressure n = function of soil behavioral type (Ic)


Figure 4.31 CPT-based liquefaction potential for clean sands.

Figure 4.32 CPT-based liquefaction potential for silty sands.

