Interpretation of Test Results in Coarse-Grained Soils
In freely draining coarse-grained soils, the advance of the CPT/CPTU represents drained penetration, and the results are not subject to pore water pressure effects that may be present in fine-grained soils.
Relative Density
Interpretation of the relative density in granular soils may be made directly using the cone tip resistance qc and a number of published empirical correlations, as summarized by Robertson & Campanella (1983a). Most of the early work relating to the CPT was performed in large calibration chambers with different sands and showed that no single relationship exists between cone tip resistance and relative density for all sands. Soil variables such as stress history, mineralogy, grain-size distribution, angularity, compressibility, and aging influence the correlations.
Schmertmann (1978b) had presented a chart for estimating relative density from tip resistance obtained with an electric cone for normally consolidated, saturated, recent, uncemented, fine, SP sands. Relative density was related to the tip resistance, qc, for different values of vertical effective stress, o«„ and was based on K0 calibration chamber tests on six different sands. Schmertmann (1978b) noted that such a correlation would overestimate the relative density in the case of overconsolidated sands and suggested an approach to estimate the relative density taking into account the effects of effective lateral stresses higher than for the normally consolidated case.
Correlations presented by Baldi et al. (1981, 1982, 1986) and Jamiolkowski et al. (1988) appear to be commonly used in sands, Figures 4.18 and 4.19. Most correlations however are for relatively uniform, clean sands that often bear little resemblance to natural field sands that may originate from a wide range of geologies. Suggested correlations are given in Table 4.3.
Kulhawy & Mayne (1990) suggested correlations between a dimensionless normalized
cone tip resistance parameter (QCD = (q,./pa)/(a(o/pa)0Sj and relative density taking into account stress history and compressibility, as shown in Figure 4.20; pa = atmospheric pressure.
More recently, Mayne (2014) has reevaluated available data and presented a global correlation between relative density and tip resistance, shown in Figure 4.21. Again, it should be noted that both stress history and compressibility influence these correlations, and estimates of D,. could be off by 15%-30%.
State Parameter
The concept of the state parameter to characterize the behavior of sand was suggested by Been & Jefferies (1985). The term “state” is used to describe the physical conditions under which the material exists since the material behavior will be controlled by these conditions. The most important physical conditions that define the current state of a soil and would therefore control its behavior are void ratio and stress level. The state parameter combines the influence of void ratio and stress level for each sand by reference to an ultimate or steady state.


Figure 4.19 Correlation between relative density and normalized cone tip resistance in sands. (After Jamiolkowski et al. 1988.)
Table 4.3 Reported correlations for estimating relative density from CPT
|
Correlation |
References |

|
Baldi et al. (1986a) |

|
Jamiolkowski et al. (1988) |

|
Mayne (2014) |
The steady state line for a particular sand represents a condition of no dilation during shear and has been discussed in great detail in the literature (Castro 1969; Poulos 1981; Castro et al. 1985). The position and slope of a steady state line in е-o' space is a reference state that is different for different sands and depends on other material properties such as grain-size distribution, limiting void ratios, mineralogy, particle shape, compressibility, and friction angle at constant volume, (p„. As illustrated in Figure 4.22, the state parameter is given by the difference between the current void ratio, and the void ratio at steady state at a given stress level and is denoted as i. Been et al. (1986, 1987) presented a comparison between the normalized net cone tip resistance (i.e., (qc - Ovo)/g(.0) and State Parameter, vp, for a number of sands, shown in Figure 4.23.

Figure 4.20 Correlations between normalized tip resistance and relative density. (After Kulhawy & Mayne 1990.)

Figure 4.2I Correlation between normalized CPT top resistance and relative density. (From Mayne 20I4.)

Figure 4.22 Definition of state parameter for sands. (After Been & Jeffries 1985.)

Figure 4.23 Steady state lines for a number of sands. (After Been et al. 1986)
Shear Strength (Drained Friction Angle)
Engineers may wish to make an estimate of the drained friction angle of granular soils for use in the design of foundations, for calculating earth pressures behind retaining structures or for other applications. Several approaches have been used to estimate cp' from CPT qc including theoretical analysis by deep bearing capacity theory, theoretical analysis by cavity expansion theory, and empirical correlations based on other test results to give cp'.
ȹ' from Deep Bearing Capacity Theory
Several studies (e.g., Muhs 8c Weiss 1971; Janbu 8c Senneset 1974; Chapman 8c Donald 1981) have noted a correlation between qc and Nq, Terzaghi’s bearing capacity factor for general shear, (p'may be estimated using an appropriate chart for Nq found in most foundation engineering texts. The bearing capacity approach presented by Durgunoglu & Mitchell (1973) has been one of the most popular methods for determining friction angle from CPT tip resistance. The method assumes a cone roughness factor and requires knowledge of the normal stress around the cone. The method cannot account for soil compressibility and tends to underestimate the secant friction angle, (p's.
Robertson 8c Campanella (1983a) reviewed a number of calibration chamber studies and compared correlations between the bearing capacity number, Nq = qc/Ov0, and drained friction angle, Figure 4.24. The correlation is somewhat sensitive to soil compressibility as well as the assumed shape of the failure surface. The correlation proposed by Robertson 8c Campanella (1983) is shown by the solid line of Figure 4.24 and can be expressed as

where qc and
ȹ' from State Parameter
The relationship between peak drained friction angle and state parameter for a number of sands is shown in Figure 4.25

Figure 4.24 Correlation between tip resistance and friction angle for sands. (After Robertson & Campanella 1983.)
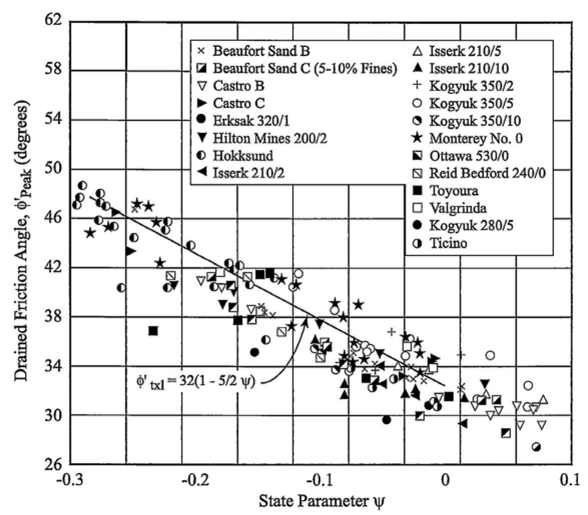
Figure 4.25 Relationship between peak drained friction angle and state parameter. (After Been & Jeffries 1985.)
Kulhawy and Mayne (1990) summarized the available friction angle data reported in the literature for sands compiled based on calibration chamber data that gave a general correlation between friction angle and normalized tip resistance as

An updated chart was presented by Mayne (2014) and included data from Uzielli et al. (2013) as shown in Figure 4.26. The results of Uzielli et al. (2013) use a power function as
Ф' = 25.0(qt|)OI°

