Presentation of Test Results
Presentation of DMT results should always show plots of the corrected pressure readings, P0, P,, and P2 versus depth. Plots of P0 and P, vs. depth should also include a plot of the in situ vertical effective stress as a reference. Similarly, the plot of P, vs. depth should include a plot on in situ pore water pressure as a reference. Examples are shown in Figures 6.13-6.16.
Figure 6.13 shows DMT results obtained at a site in Keene, NH, which consists of alluvial sands overlying a soft lake clay deposit. A casing was set through some random fill before the DMT was started. The transition between the two layers can easily be seen at a depth of about 14m. Comparison of the P, reading with the in situ pore water pressure shows hydrostatic conditions in the sand but elevated (excess) pore water pressures in the clay. The DMT Indices, shown in Figure 6.14, indicate the transition from the coarse-grained to finegrained materials by the Material Index, ID, and the DMT Modulus, ED.
Figures 6.15 and 6.16 show results obtained at a site in Massena, NY, which consists of very soft sensitive marine clay. The soils are uniform throughout the profile.

Figure 6.13 Presentation of DMT pressures P0, P,, and P2 - Keene, N.H.


Figure 6.15 Presentation of DMT pressures P0, P,, and P2 - Massena, N.Y.

Interpretation of Test Results
Evaluating Stratigraphy
A specific application of the results of a DMT profile is in determining changes in subsurface stratigraphy. This can be done primarily from the soil’s point of view since the test results will be dependent on the behavior of the soil during and after penetration by the blade. This part of the test should not be considered as a detailed primary use of the instrument in contrast to a CPT and CPTU profile in which the results are nearly continuous and thus more detailed. As such, the DMT is not meant to be competitive with the CPT or CPTU but more complimentary in terms of the overall scope of an in situ testing program, since the DMT can provide additional soil data to help in the delineation of the subsurface profile and specific property evaluation.
Soil identification or “classification” using the DMT should be thought of in terms of soil behavior as opposed to specific composition, such as is done with laboratory or visual-based soil classification systems. This is essentially the same as the systems used to provide soil identification from CPT/CPTU results, wherein the results of the test are used in a rational way to help determine the nature of the material which is being tested. As described in Chapter 4, soil identification systems most commonly used with the CPT/CPTU make use of tip resistance, sleeve resistance, and pore water pressure to identify the soil type. Similarly, with the DMT, the lift-off pressure, 1 mm expansion, and recontact pressure can be used to identify the soil.
One way to evaluate changes in site stratigraphy is to examine the plot of the pressure readings P0, P,, and P2 vs. depth as shown in Figure 6.13 and look for changes in test results. Changes in stratigraphy are indicated by abrupt changes in the trends of all three values. The variation in the recontact pressure, P2, vs. depth appears to be one of the easiest ways of noting changes in stratigraphy much in the same way that pore pressure from a CPTU is used, especially while the test is being performed. A comparison with the in situ pore water pressure profile gives a rapid indication of fine-grained vs. granular soil layers, since the P, profile in a saturated granular soil will essentially follow the in situ pore water pressure profile.
Marchetti (1975) had proposed a simple system based on the DMT Material Index, ID, that could be used to establish the soil type as shown in Table 6.2. As ID increases, the soil type changes from very soft cohesive to very stiff granular, with several intergrades. From Equation 6.6, ID defines the relative change in pressure from P0 to P, normalized with respect to P0 and accounting for the in situ pore water pressure. The variation in KD and ED can also be used to show changes in soil behavior.
The Pore Pressure Index, UD, defined by Equation 6.9 has also been shown to be a useful parameter in determining site stratigraphy (Lutenegger &c Kabir 1988). Variations in UD indicate changes in soil drainage conditions and the tendency for the soil to generate excess positive pore water pressures during blade penetration. This means that a plot of UD vs. depth helps indicate changes in soil stratigraphy. UD can be used to distinguish “permeable” layers (Ud<0.2) from “impermeable” layers (UD>0.6). Intermediate materials will typically fall in between, (i.e., 0.2
Table 6.2 Soil identification using material index, lD
|
Soil type |
Peat or sensitive clay |
Clay |
Silt |
Sand |
||||
|
Silty |
Clayey |
Sandy |
Silty |
|||||
|
Id |
<0.10 |
0.10 |
0.35 |
0.60 |
0.90 |
1.2 |
1.8 |
3.3 |

Figure 6.17 Variation in UD from data of Figures 6.13 (left) and 6.15 (right).
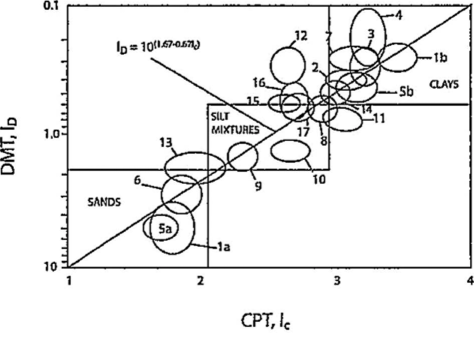
Robertson (2009) identified an approximate relationship between the CPT Soil Behavioral Type Index, Ic, previously described in Chapter 4, and the DMT Material Index, ID, which is shown in Figure 6.18 and which can be expressed as follows:

There is also some evidence that the DMT Material Index, ID, is related to the friction ratio, obtained from the CPT.