Sensitivity
Schmertmann (1978b) suggested that sensitivity, St, could be estimated from
 where
(field vane) — Sensitivity
Ns = an empirical factor Rf = friction ratio
Schmertmann (1978b) suggested a value of Ns= 15 for Rt from a mechanical CPT and St obtained from Nikon or Geonor type field vane. Robertson & Campanella (1983b) suggested
Ns = 10 for electric cone data. Greig et al. (1986) and Robertson et al. (1986) suggested Ns = 6 for data collected from clays in the Vancouver area. Robertson (2009) suggested that sensitivity could be estimated from CPTU results using the normalized friction ratio as

where

If the sleeve friction can be taken as an estimate of the remolded strength, then sensitivity may also be obtained by combining sleeve resistance with an estimate of undisturbed strength from tip resistance or pore pressure.
Stress history – Preconsolidation Stress, Ϭ'p
The results of the CPT/CPTU may be used to make an estimate of the stress history of clays, by either estimating the preconsolidation stress, o'p, or the overconsolidation ratio, OCR. Both empirical and analytical models have been suggested predicting o'p and OCR using the corrected tip resistance or pore water pressure. More rigorous numerical models have also been used. Chen & Mayne (1994) presented a review of the various approaches suggested. In some cases, piezocones with multiple pore water pressure sensor locations are required. Table 4.8 summarizes the different approaches for estimating stress history for CPT/CPTU results.
Ϭ'P from qc
A direct relationship between qc and the preconsolidation stress, o', has been noted for different clays. Tavenas 8c Leroueil (1987) showed that for sensitive Canadian clays

Mayne & Kemper (1988) suggested a general correlation between qc and 0P as

Table 4.8 Summary of empirical approaches for estimating stress history from CPT/CPTU
|
Parameter |
General correlation |
References |
|
O'p |

|
Tavenas & Leroueil (1987) Mayne & Kemper (1988) |

|
Mayne (1986) Tavenas & Leroueil (1987) |
|

|
Powell et al. (1989) |
|

|
Roy et al. (1981) Powell etal. (1989) Mayne (1995) |
|

|
Op =0.8(qt-U|) |
|
|
OCR |

|
Mayne & Kemper (1988) |

|
Sully et al. (1988) |
|

|
Chen & Mayne (1994) |
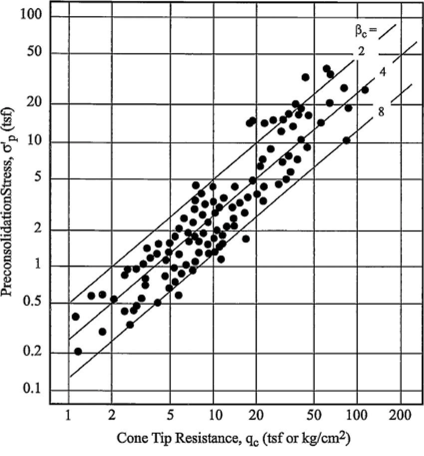
Figure 4.33 Correlation between a'? and CPT tip resistance. (After Mayne & Kemper 1988.)
As shown in Figure 4.33, values of kc for both electric cones and for mechanical cones vary between about 2 and 8. A general trend to these data which may be useful for preliminary work may be taken as

It has also been suggested (e.g., Mayne 1986; Tavenas & Leroueil 1987) that an estimate of Op may be made using the net tip resistance, qc - cvo.
Ϭ'P from qt
Empirical correlations between the preconsolidation stress, o'p, and the corrected cone tip resistance, qt, have been suggested for a number of different clay deposits. These correlations have the general form

The value of a, typically is in the range of 0.20 to 0.40. Table 4.9 presents a summary of different reported values of at. The use of Equation 4.73 and a, requires that pore pressure be measured behind the cone base, i.e., in the u2 position so that qc may be corrected to qt. Data collected by Mayne (1995) are shown in Figures 4.34 and 4.35.
c'p from Δu
Based on the results of pile tests, Roy et al. (1981) suggested that g'p could be related directly to the pore pressure difference Au = ux - uD for sensitive clays in Canada. For Au measured at the pile tip, they found that

Table 4.9 Reported values of at
|
«. |
Soil |
References |
|
0.20 |
Clay till, UK |
Powell et al. (1989) |
|
0.30 |
Soft clay |
Powell et al. (1989) |
|
0.29 |
Swedish clays |
Larsson & Mulabdic (1991) |
|
0.34 |
Norwegian clays |
Lunne et al. (1992) |
|
0.28 |
Eastern Canada clays |
Leroueil et al. (1995) |
|
0.33 |
U.S. clays |
Mayne (1995a) |
|
0.30-0.45 |
Polish clays |
Borowczyk & Szymanski (1995) |
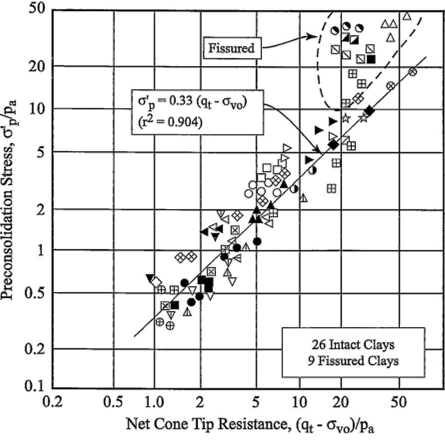
Figure 4.34 Estimation of o'p from CPTU net tip resistance. (After Mayne 1995.) for Au measured on the shaft,

Since the pore water pressure obtained from the CPTU is dependent on the location of the piezoelement, specific correlations for predicting o'p from Au would be needed for different cone designs. Mayne (1995) presented a summary of the available data shown in Figures 4.36 and 4.37, which shows that

and

Note that fissured clays do not follow the trend lines of these data since the measured pore water pressures are often dependent on other soil behavior. In highly overconsolidated clays, Equation 4.46b may not provide a realistic estimate of c'p since Au may be zero or negative during penetration (Figure 4.37).

Figure 4.35 Global estimation of Op from CPTU net tip resistance. (From Mayne I995.J
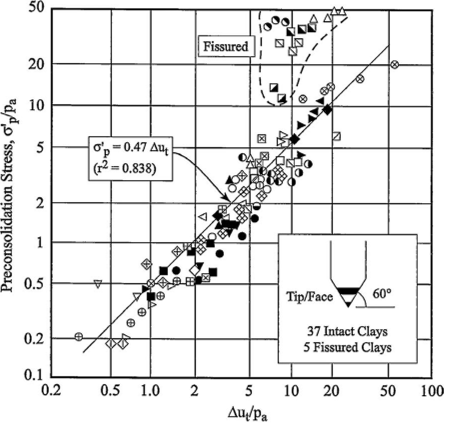
Figure 4.36 Estimation of Op from Ди, (Type I). (After Mayne 2006.)

Figure 4.37 Estimation of Op from Ди2 (Type 2). (After Mayne 2006.)
Ϭ'P from qt and u
Results presented by Mayne & Chen (1994) suggested that OCR may be determined from using both qt and u. This approach may be used to make a direct estimate of o'P as

